
Ronald Inglehart has recently published an article in Foreign Affairs called “Giving up on God: the global decline of religion” in which he uses data from the most recent wave of the World Health Surveys (WVS) to claim that between 2007 and 2019, the importance of religion has declined in most countries [1]. This is based on a single question on the importance of God in the respondent’s life on a 10-point scale. The average importance declined in 39 countries and increased in only 5. Apart from the fact that this is based only on a single question on the importance of God, it also does not tell us how regional or global average ratings have changed. Depending on the relative populations and scale shifts in different countries, it could potentially even be consistent with a global average increase.
In this post, I examine country, regional and global trends in religiosity in terms of the four categories of religiosity used in my previous post, and also using a continuous latent variable measuring religiosity based on the religiosity categories (which incorporate religious practice and belief/disbelief in God) plus responses on the importance of religion, the importance of God, and frequency of religious practice. In doing this analysis, I have slightly revised the religiosity categories from those used previously, as follows:
Atheist: A “confirmed atheist” and/or does not believe in God
Non-religious: A non-religious person who believes in God, but rates the importance of God as 8-10 at the not important end of a 10-point scale.
Non-practicing religious person: A religious person who believes in God and is non-practicing OR a non-religious person who believes in God, is non-practicing, and rates the importance of God in range 1-7.
Practicing religious person: A religious person who believes in God and is practicing, OR a non-religious person who believes in God, is practicing, and rates the importance of God in range 1-6. Respondents are classified as “practicing” if they attend religious services or pray to God outside of religious services at least once a month.
Modified versions of these definitions are used for persons stating affiliation to a non-theist religion and for the predominantly Buddhist countries (see Endnote a). Data from the World Values Surveys (WVS) and European Values Study (EVS) are used to classify the religiosity of over 630,000 respondents in 110 countries over the period 1981 to 2020 [2-5].
In preparing the estimates of religiosity across waves of the World Values Survey, I discovered that the question on belief in God had been omitted for Wave 5 (2005-2009) as well as from a few surveys on other WVS and EVS waves, preventing the classification of religiosity for those country-years. Responses for this question were imputed using country-specific distributions as described in Endnote b.
I was not happy with the projection method I had previously used to project religiosity to year 2020 as it used trend from the 6th to 7th wave which were large in some countries and possibly biased by cross-survey differences in sampling or survey methods. More robust and conservative methods for preparing time series from 1980 to 2020 have now been used as described in Endnote c.
Country-level trends in religiosity and atheism
The following plots show trends in the prevalence of the four religiosity categories from 1980 to 2020 for 6 representive countries from different religious/culture zones. High income countries in Western Europe and North America are characterized by declining religiosity and rising prevalence of atheism. Former Communist countries of Europe are characterized by a drop in atheism after the breakup of the Soviet Union, some rising in the practicing religious and a much larger rise in the non-practicing religious. As noted in my previous post, the non-practicing religious see their religion (Orthodox Christianity or Islam) as a strong marker of cultural belonging and national identity [6]. The vast majority of people in Africa and Islamic countries are religious, though substantial proportions are non-practicing, and the prevalence of irreligion (non-religious and atheists) is very low.
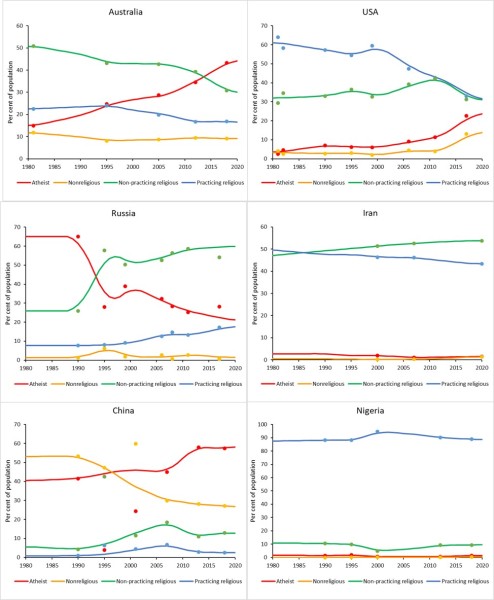
In his article [1], Inglehart notes that the USA has had the sharpest decline in the importance of God of all the countries in the WVS, and now ranks as the 11th most irreligious country (based on the single question he analyzed). The plot above for the USA also shows a very substantial rise in the prevalences of atheism and non-religious across the last two waves, and a corresponding decline in non-practicing and practicing religious prevalences. Based on my classification of religiosity categories, the USA is now ranked 28th in the world for prevalence of atheism and ranked 5th in the world for the rate of decline of the percent who are practicing religious people. If I exclude China and South Korea due to the difficulties in classifying religiosity in the Sinic countries with high prevalence of non-theistic religion, then the USA has the 3rd highest rate of decline after Chile and Denmark, but these countries all share a very similar rate of decline over the last decade around 3.5% per year.
Based on my estimates for 2020, China has the highest proportion of atheists (79%), followed by Czechia (70%), Sweden (68%), Estonia (64%) and the Netherlands (60%). Other countries in which more than 50% of the population do not believe in God include Norway, the United Kingdom, South Korea, France and Denmark. Other countries of interest (to me) include Australia (45%), Switzerland (36%) and the USA (25%). I was expecting to see a lower prevalence for the USA and checked the data carefully. There have been 8 survey waves for the USA covering the period 1981 to 2017 and they show that the prevalence of atheism has been rising much faster in the last 15 years than earlier, and that the prevalence of “non-religious” has also been rising, reaching an estimated 10% in 2020. This category includes people who say they believe in God, but are non-religious and rate the importance of God as 8-10 on the unimportant end of a 10-point scale. I suspect these are people who are close to no belief in God, but unwilling to make the step of saying that. The USA is one of very few countries in the world where this category is more than 1 or 2 percent of the population.
China has the largest prevalence of atheism in the world at an estimated 78% but as the plot shows there has been a substantial shift from the non-religious category to the atheist category and it is difficult to interpret this given the lack of fit of the WVS questions with the non-theist religions that are most common in China.
Religiosity in Iran and other Islamic countries
Iran and other Islamic countries generally report very low levels of atheism, 2.4% on average, and I suspect this is lower than reality because of the quite severe social and legal consequences in many Islamic countries. The WVS uses telephone interviews and its quite likely irreligious respondents would be fearful of being identified if they respond honestly to a telephone interview. A recent internet survey provides some support for this concern. The June 2020 internet-based survey collected responses from 40,000 Iranians living in Iran [7]. Respondents took part in the survey anonymously, and would have felt safer to express their real opinions than in telephone surveys or surveys conducted at respondents’ residence.
According to this survey, 40.4% of Iranians identify as Muslim, 8% as Zoroastrian and 9% as atheist (12% if those who identify as humanist are included). Most Iranians, 78%, believe in God, but only 37% believe in life after death and only 30% believe in heaven and hell. Around 20% said they did not believe in God or other supernatural beings such as jinns or genies.
The contrast with the results of the most recent 2020 World Values Survey for Iran are extreme. The latter found that 43% of Iranians are practicing Muslims (similar to the online survey estimate for total Muslims, 53% are non-practicing and only 1.5% say they do not believe in God. In the WVS, 91% say they believe in life after death, 92% believe in heaven and 88% believe in hell. The online survey found that over 60% said they did not perform the obligatory daily Muslim prayers. This is in the same ballpark as the 53% who were classified as non-practicing in the WVS.
Reading between the lines of the WVS, and taking into account the severe consequences of being apostate or atheist in Iran, it supports the conclusion of Maeki and Arab that Iran is becoming much more secular. Around 53% of respondents in their online survey reported coming from practicing religious families but losing or changing their religion in their lifetime. This increasing secularity is also supported by the evidence of dramatic declines in the fertility of Iranian women over recent decades, with population growth in 2020 dropping below 1%. Its quite likely that real levels of irreligion are higher in many other Islamic countries than the survey data suggest.
Culture zone trends in religiosity and atheism
In my previous post, I used a slightly modified classification of countries into ten culture zones based on those of Welzel [8]. These are defined in Endnote d. The following plots show time trends for the religiosity categories in each culture zone. These are population-weighted averages for the countries included in the WHS/EVS for each culture zone. Turkey is the only Islamic country with data before 2000 and its trends are not likely to be representative for other Islamic countries. So for the other Islamic countries I have simply projected the earliest data backwards at constant values for the purpose of computing global trends.
The prevalence of atheism is rising in the four culture zones of the West, fastest in North America in the last decade. But it has been rising in the Reformed West (which includes Australia and New Zealand) for more than four decades and its prevalence is now an estimated 49% for the whole zone. The Orthodox East (former Soviet zone countries with Orthodox Christian or Muslim majorities) shows the religious rebound after 1991 discussed earlier, though the majority of the new religious are non-practicing. Religiosity trends have been fairly flat in the Islamic East and Sub-Saharan Africa with apparently very low levels of irreligion (though that may reflect unwillingness to risk disclosing irreligon). There is an apparent switch between non-religious and atheist in the Sinic Zone, though as noted earlier this could be affected by the orientation of the WVS religious questions towards theist religions.

At global level, the prevalence of practicing religious has barely changed over the last 40 years, as has the prevalence of atheism, but there has been a shift from non-religious to non-practicing religious, reflecting mainly the change in former Soviet bloc countries. Excluding China, there is a slight decline in the prevalence of atheism but overall, there has been relatively little change in prevalence of religiosity at global level over the last 40 years. This conceals quite substantial changes in developed countries and in former Soviet countries, in opposing directions. Note that the regional and global trends are based on population-weighted averages for the 110 countries included in the WVS/EVS dataset. Many of the countries not included are small except in Africa which is represented by only 10 countries, though these include large countries like Nigeria and South Africa.

Trends in average religiosity over the last 40 years
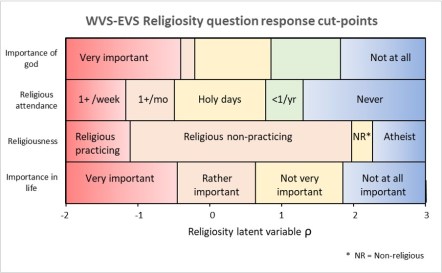
It is entirely possible that while the prevalences of religiosity categories have changed little, the average religiosity within categories has changed, for example through less frequent religious observance, or lesser importance placed on God in the respondent’s life (as used by Inglehart for his claim that religion is in global decline). To examine this, I have used the set of religiosity variables in the WVS/EVS to compute a continuous latent variable ρ for religiosity using item response analysis [9, 10] to estimate the latent variable from the categorical response variables measuring aspects of religiosity. This was implemented as an ordered probit model using the stata procedure gsem for generalized structural equation models [11]. The model was fit to the entire dataset for all countries and all survey waves. The item response cut-points for the questions used as independent variables are shown in the following figure.
At individual level, 90% of values of the religiosity latent variable fall in the range -5.93 to 6.88 with a median value of 0.365. At country level, average religiosity ranged from -4.6 in Nigeria in 2000 to 4.71 in China in 1990. Country averages for the most recent WVS/EVS wave for 2017-2020 ranged from -4.4 in Ethiopia to 4.34 in China, followed by 3.73 in Czechia and 3.49 in Sweden. Note that negative values indicate higher levels of religiosity and positive values indicate higher levels of irreligion.
Trends in average religiosity were imputed for the period 1980 to 2020 using the same methods as for the categorical religiosity prevalences (endnote c). Again, this is a population-weighted average of all 110 countries for which there are WVS/EVS data, not all of the around 194 countries in the world (most of the missing are very small countries such as the Pacific Islands).

The large increase in irreligion in North America stands out, as does the more steady increase in the Reformed West, and the decrease in irreligion following the collapse of the Soviet Union and other Eastern Bloc countries around 1991. However, the continuous latent variable also picks up an increase in religiosity in Sub-Saharan Africa and an decrease in religiosity post-2000 in Latin America, the Old West and the Returned West. At global level there has been a slight increase in religiosity over the forty year period. This is the opposite conclusion to that reached by Inglehart in his recent Foreign Affairs article.
The next question I will look at is whether religious values are changing in the direction of increasing or decreasing fundamentalism and the extent to which religion is associated with rejection of scientific evidence and findings: important questions for a world facing the twin crises of climate change and the coronavirus pandemic. To be continued.
Endnotes
a. Revised definitions of religiosity and atheism
The WVS/EVS questions, and those of other similar survey programs, are biased towards monotheistic religions and do not adequately take the non-theistic religions into account (these include Buddhism, Confucianism, Taoism, Jainism). Thus “confirmed atheist” is a separate category to “religious person” although around half of practicing Buddhists in the surveys said they do not believe in God. For respondents who report affiliation with a non-theistic religion (or who report religion as “None” in Sinic countries, Thailand and Myanmar(, the religiosity categories are modified as described below. A more accurate label for the “Atheist” category that takes non-theist religious people into account would be “Non-religious atheist”. The classification for non-theists is as follows:
Atheist: A confirmed atheist”, practicing once a year or less and considers religion to be “not at all important”, OR a religious or non-religious person who does not believe in God, is not practicing and considers religion to be “not at all important”
Non-religious: A not religious person, who believes in God but considers religion not at all important, and is not practicing.
Non-practicing religious person: A religious person who is non-practicing OR a non-religious person or confirmed atheist who practices less than once a month and more than once a year, and rates the importance of religion greater than “Not at all”
Practicing religious person: A religious person who is practicing at least once a month OR a not religious person or confirmed atheist who is practicing at least once a month and considers religion to be more than “Not at all important”
This is not entirely adequate to deal with the non-theist issue, as adherents of non-theist and folk religions may often interpret the question on religious affiliation as referring to the major established religions, and respond “None”. This is only an important issue for Sinic countries and other countries in Asia where Buddhism is a major religion. The religiosity results for these countries should be treated with caution, they vary substantially across the countries and across waves and time, and its likely that there are considerable measurement issues resulting from variable interpretation of questions framed largely for theist religious beliefs.
b. Estimation of missing values for belief in God
Questions on belief in God, heaven and hell are missing for all 59 countries in Wave 5 of the WVS and from 25 other countries in various other waves of the WVS and EVS. An EVS survey is available for the same survey year for around half these countries, and the questions are available in adjacent waves for all the other countries with missing data.
Because belief in God is a crucial input to the classification of religiosity, an effort was made to impute it using data from the EVS surveys for the same year, when or available, or adjacent years on either side. A country-level probit model for belief in God (Yes, No) was fitted to data for the comparison years for the questions “How important in life is religion?”, “Are you a religious person?” and “How often do you attend religious services?”. The regression model was then used to impute belief in God at individual respondent level for those surveys where that question was missing. A similar imputation model was used for belief in hell.
c. Interpolation and projection of religiosity trends from 1980 to 2020
For countries with data for three or more waves of the WVS+EVS, trends in the prevalence of the four religiosity categories were estimated at country-level as follows:
- Values for single missing waves between two other waves were estimated using the geometric average for the two waves with data
- For countries in the Returned West or Orthodox East, the average change in prevalences due to the breakup of the Soviet Union was estimated using the average for those countries with data for the first wave in the 1980s and the second wave in the 1990s. This average jump was used to estimate values for the first or second wave for countries where one of these was missing.
- For countries where one or more early waves or one or more late waves were missing, prevalences were projected forwards or backwards using the median annual rate of change calculated at culture zone level for countries without missing waves.
- Population-weighted average trends were then calculated for each culture zone with the following two exceptions. For the Returned West and Orthodox East, prevalences were assumed constant prior to 1991. For Islamic East countries, flat trends were assumed from 1980 to earliest available data, as Turkey is the only Islamic country with data prior to 2000, and its trends are probably not representative.
For countries with data from only one or two waves, forward and back projections to 1981 and 2018 were made using the average trends calculated in step 4 above for each culture zone.
For projections from the Wave 7 survey year to 2020, a conservative approach was taken to avoid making extreme projections based on substantial differences between Wave 6 and Wave 7 estimates which may reflect variations in survey sampling or procedures rather than real change. For each country, the recent trend was estimated using data from survey waves in the period 2000-2020, with each earlier wave being given 15% less weight in the regression than the subsequent wave. Average annual rates of change (aar) were also calculate from the Wave 6 and Wave 7 average prevalence estimates for each culture zone.
Where the regression aar were more extreme than the culture zone average aar, an average of the two was used for projection to 2020. Where the regression aar and the culture zone aar were of opposite signs, the regression aar was halved before use for projection. To be even more conservative, if the last Wave for a country was more than a year earlier than 2020, the rate of change from the survey year to 2020 was assumed to be aar1.5.
Finally, annual estimates for all years from 1980 to 2020 were prepared as follows:
- Values prior to 1981 (the actual or projected first wave values) were assumed to be constant at the first wave values
- Values beyond 2020 were also assumed to be constant at the 2020 value
- Annual values between waves were estimated by linear interpolation
- Annual values from 1980 to 2020 were smoothed using a 5-year moving average.
d. Definitions of culture zones used to group countries
I am using the 10 culture zones defined by Welzel [8], with one modification. Because Australia’s and New Zealand’s culture values are much closer to the countries of the Reformed West than to those of the USA and Canada, I have included Australia and New Zealand in the Reformed West and renamed the New West as North America. The culture zones are defined as follows:
Reformed West — Western European societies strongly affected by the Reformation: Denmark, Finland, France, Germany, Iceland, Netherlands, Norway, Sweden, Switzerland, United Kingdom, plus Australia and New Zealand;
North America — USA and Canada;
Old West — Mostly Catholic parts of Western Europe being core parts of the
Roman Empire: Austria, Belgium, Cyprus, Greece, Ireland, Israel, Italy, Luxembrg, Malta, Portugal, Spain;
Returned West — Catholic and Protestant parts of post-communist Europe returning
to the EU: Croatia, Czechia, Estonia, Hungary, Latvia, Lithuania, Poland, Slovakia, Slovenia;
Orthodox East — Christian Orthodox or Islamic parts of the post-communist world,
mostly parts of former USSR;
Indic East — Parts of South and South East Asia under the historic influence
of Indian culture: Bhutan, Cambodia, India, Indonesia, Laos, Malaysia, Maldives, Myanmar, Nepal, Pakistan, Philippines, Singapore, Sri Lanka, Thailand, Timor-Leste;
Islamic East — Regions of the Islamic world that have been parts of the Arab/Caliphate,
Persian and Ottoman empires;
Sinic East — Parts of East Asia under the historic influence of Chinese culture: China, Hong Kong, Japan, Macau, Mongolia, North Korea, South Korea, Taiwan, Vietnam;
Latin America — Central and South America and the Caribbean;
Sub-Saharan Africa — African countries south of the Sahara.
References
- Inglehart R Giving up on God: the global decline of religion. Foreign Affairs 2020, 99(5): 110-118.
https://www.foreignaffairs.com/articles/world/2020-08-11/religion-giving-god - Inglehart, R., C. Haerpfer, A. Moreno, C. Welzel, K. Kizilova, J. Diez-Medrano, M. Lagos, P. Norris, E. Ponarin & B. Puranen et al. (eds.). 2014. World Values Survey: All Rounds – Country-Pooled Datafile Version: https://www.worldvaluessurvey.org/WVSDocumentationWVL.jsp. Madrid: JD Systems Institute.
- Haerpfer, C., Inglehart, R., Moreno,A., Welzel,C., Kizilova,K., Diez-MedranoJ., M. Lagos, P. Norris, E. Ponarin & B. Puranen et al. (eds.). 2020. World Values Survey: Round Seven–Country-Pooled Datafile. Madrid, Spain & Vienna, Austria: JD Systems Institute& WVSA Secretariat[Version: http://www.worldvaluessurvey.org/WVSDocumentationWV7.jsp].
- Gedeshi, Ilir, Zulehner, Paul M., Rotman, David, Titarenko, Larissa, Billiet, Jaak, Dobbelaere, Karel, Kerkhofs, Jan. (2020). European Values Study Longitudinal Data File 1981-2008 (EVS 1981-2008). GESIS Datenarchiv, Köln. ZA4804 Datenfile Version 3.1.0, https://doi.org/10.4232/1.13486.
- EVS (2020): European Values Study 2017: Integrated Dataset (EVS 2017). GESIS Data Archive, Cologne. ZA7500 Data file Version 3.0.0,doi:10.4232/1.13511
- Pew Research Center, Oct 29, 2018. Eastern and Western Europeans Differ on Importance of Religion, Views of Minorities, and Key Social Issues. https://www.pewforum.org/2018/10/29/eastern-and-western-europeans-differ-on-importance-of-religion-views-of-minorities-and-key-social-issues/
- Maeki A, Arab PT. Iranians’ attitudes toward religion: a 2020 survey report. The Group for Analyzing and Measuring Attitudes in Iran (GAMAAN). Published online, gamaan.org: GAMAAN. https://gamaan.org/wp-content/uploads/2020/09/GAMAAN-Iran-Religion-Survey-2020-English.pdf
- Welzel C. Freedom Rising. Human Empowerment and the. Quest for Emancipation. 2013. Cambridge: Cambridge University Press. https://www.cambridge.org/core/books/freedom-rising/80316A9C5264A8038B0AA597078BA7C6
- Hambleton RK, Swaminathan H. Item Response Theory: Principles and Applications. Springer Science and Business Media, New York. 1985.
- Nguyen TH, Han HR, Kim MT, Chan KS. An introduction to item response theory for patient-reported outcome measurement. Patient. 2014;7(1):23-35. doi:10.1007/s40271-013-0041-0
- Stata Corporation. Stata Structural Equation Modeling Reference Manual. Release 15. StataCorp, Texas, 2017.

Pingback: Fundamentalist values, culture and religion | Colin Mathers
Pingback: Is religious belief in decline and atheism on the rise? | Mountains and rivers
Pingback: Age Patterns of Religiosity and Atheism in the USA, Europe and Australia | Colin Mathers
Pingback: Religiosity and atheism: revised estimates for 1980-2020 | Colin Mathers
Pingback: Trends in religious belief and atheism: an update | Mountains and rivers
Pingback: Modern and pre-modern religious values: an update | Colin Mathers
Pingback: Atheism In Kenya: Why Accurate Numbers Are Hard To Come By - Empire News Africa
Pingback: Atheism in Kenya: why accurate numbers are hard to come by – The Conversation – Kwetu Buzz
Pingback: Atheism in Kenya: why accurate numbers are hard to come by - The African Mirror Test
Pingback: Atheism in Kenya: why accurate numbers are hard to come by - The African Mirror
Pingback: How many Kenyans are Christian? Accurate numbers are hard to come by – B.N.V.C.A News
Pingback: Why accurate numbers are hard to come by - Quick Telecast
Pingback: Atheism in Kenya: Why accurate numbers are hard to come by - MixPoint
Pingback: Why accurate numbers are hard to come by - Gamers Grade
Pingback: Why accurate numbers are hard to come by- TechCodex
Pingback: Atheism in Kenya: Why accurate numbers are hard to come by - TheDailyCheck.net
Pingback: Why accurate numbers are hard to come by - Verve times
Pingback: Global estimates of abortion rates by legality and region | Colin Mathers
Pingback: why accurate numbers are hard to come by – Involve Africa
Pingback: A surprising explanation for the global decline of religion .. from BigThink Ross Pomeroy - Tom Bettenhausen's
Pingback: دلیل جدید ریزش مذهب در جهان - مرد روز
Pingback: What proportion of the population are actively religious across the world? | Mountains and rivers
Pingback: 19 Facts About Atheists You Should Know - Critical Financial
Pingback: 19 Eye-Opening Facts About Atheists You Need to Know - Red Olive Media