
It is well known that the proportion of people who are atheist or non-religious in high income countries is generally higher in younger people than older people and rising over time. So is the decline in religiosity mainly a cohort or period phenomenon?
I have analysed age patterns in religiosity using data from the last three waves of the World Values Survey and the European Values Study [1-4]. See previous posts here and here for more details on the analysis of these surveys. I chose to look at the USA and compare it with the eight high income countries in which the prevalence of irreligion (atheism and the non-religious) exceeds 50%: Australia, Denmark, Finland, France, Netherlands, Norway, Sweden and the United Kingdom. The non-religious category is quite small in these countries, apart from Australia, and includes people who say they believe in God, but say they are non-religious and rate the importance of God as 8-10 on the unimportant end of a 10-point scale.
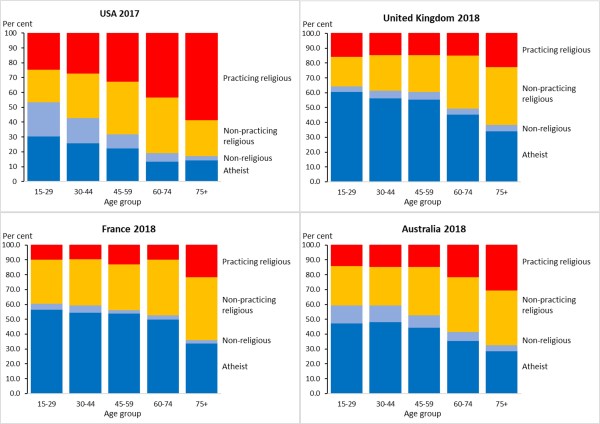
The proportion of people who are religious rises with age and the proportion who are irreligious declines. Trends and levels are quite similar for the three high-atheism countries. The following plot aggregates the overall prevalences by sex for the seven European countries and compares them with those for the USA.
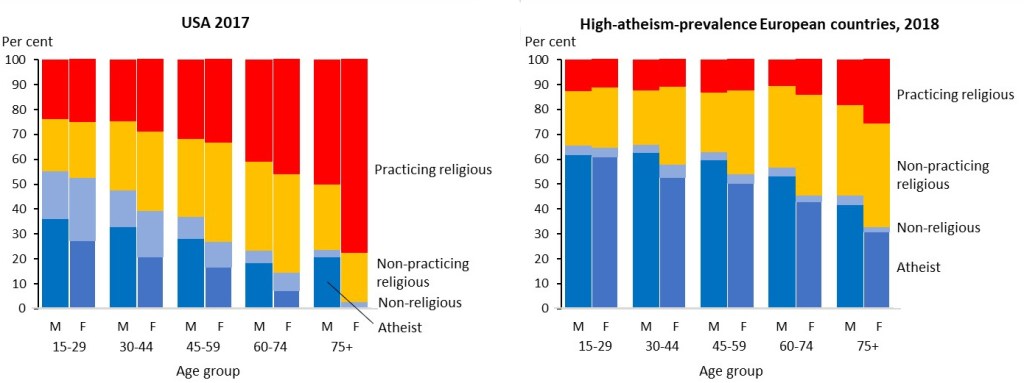
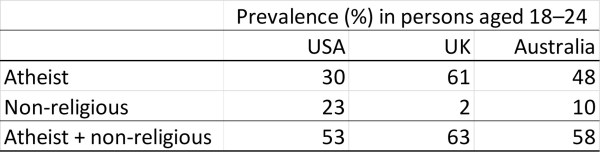
Across all age groups apart from 15-29 years, the prevalence of irreligion is higher in men than women. The proportion of religious people who are non-practicing rises to middle age and then declines in older ages in the USA. In contrast, the proportion who are practicing religious remains fairly low in the European countries (ranging from 10 to 20%) whereas the proportion non-practicing rises with age. The prevalence of irreligion in the youngest age group (18-24 years) exceeds 50% in 2018 in all the countries analyzed, including the USA.
Next, I compare time trends across the three last waves of the surveys for these countries. The plot on the left below shows age-specific trends in the per cent of people who are irreligious and that on the right the trends in the per cent of people who are practicing religious.
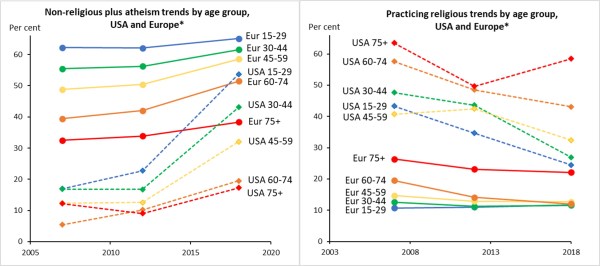
Although the prevalence of irreligion is lower in all age groups in the USA compared to the European countries, it is rising rapidly in all age groups under 60 years, and will likely catch up to Europe soon. Trends are much smaller in Europe as much of the growth in irreligion occurred decades earlier, whereas it has really only started to increase substantially in the USA in the last decade.
Is the rise in irreligion dominated by cohort or period effects? As in the epidemiology of diseases [5], there are three time factors that are potentially explanatory: the age of the person, the year (period) in which the population is surveyed, and the year in which a person is born (cohort). Potentially, in the absence of any other influences, the prevalence of irreligion might change with age (people may get disillusioned with religion as they get older, or perhaps more religious as they age). Perhaps the birth cohort is a major factor: as a marker of the social and religious milieu around the time when a person reaches adulthood and makes their own decisions about religious beliefs and practices as an adult. Or perhaps changes in the social, economic and political environment affect people across all ages and birth cohorts so that everyone becomes more or less religion over periods of time. These three factors are not independent, since cohort = period – age. Thus, it is not possible to statistically estimate the independent contributions of all three factors, unless one factor can be specified from external data or knowledge [5].
I will assume that there is no independent age effect. Given the fairly flat trends by age over periods in which social and religious conditions have been relatively stable, I think this is a reasonable first approximation that allows us to gauge the relative importance of cohort versus period effects. I ran fairly simplistic linear regressions of the form
yx = β0x + β1x .period + β2x .cohort + ε
where yx denotes the prevalence (%) of religiosity category x. I fitted this regression to the individual country data for years 2018 and 2003, where the prevalences in 2003, calculated by backprojecting the trend between 2018 and 2007. This allowed age, cohort and period all to be measured in units of 15 years, so that the coefficient β1x gives an estimate of the average change in prevalence over a 15 year period and β2x gives an estimate of the change in prevalence between two birth cohorts 15 years apart.
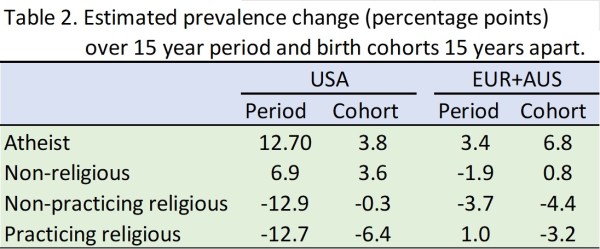
Given the simplicity of the model, and the simplifying assumptions of linear trend across age groups and periods, this gives no more than an indicative measure of the relative importance of period versus cohort effects, but it does show a very distinct difference between the USA and the high-atheism European countries.
Period effects dominate for the USA, whereas cohort effects are more important in the other countries for atheism and practicing religious. For the two middle categories, both period and cohort effects both play a relatively important role, though for smaller time trends. Almost certainly this reflects the fact that the European countries and Australia have fairly stable secular cultures and cohort effects dominate, whereas the USA over the last decade or two has become increasingly polarized on religious and cultural issues and this period effect has led to declining religiosity across all age groups that is generally larger than the cohort-specific declines, greater in younger age groups.
References
- Inglehart, R., C. Haerpfer, A. Moreno, C. Welzel, K. Kizilova, J. Diez-Medrano, M. Lagos, P. Norris, E. Ponarin & B. Puranen et al. (eds.). 2014. World Values Survey: All Rounds – Country-Pooled Datafile Version: https://www.worldvaluessurvey.org/WVSDocumentationWVL.jsp. Madrid: JD Systems Institute.
- Haerpfer, C., Inglehart, R., Moreno,A., Welzel,C., Kizilova,K., Diez-MedranoJ., M. Lagos, P. Norris, E. Ponarin & B. Puranen et al. (eds.). 2020. World Values Survey: Round Seven–Country-Pooled Datafile. Madrid, Spain & Vienna, Austria: JD Systems Institute& WVSA Secretariat[Version: http://www.worldvaluessurvey.org/WVSDocumentationWV7.jsp].
- Gedeshi, Ilir, Zulehner, Paul M., Rotman, David, Titarenko, Larissa, Billiet, Jaak, Dobbelaere, Karel, Kerkhofs, Jan. (2020). European Values Study Longitudinal Data File 1981-2008 (EVS 1981-2008). GESIS Datenarchiv, Köln. ZA4804 Datenfile Version 3.1.0, https://doi.org/10.4232/1.13486.
- EVS (2020): European Values Study 2017: Integrated Dataset (EVS 2017). GESIS Data Archive, Cologne. ZA7500 Data file Version 3.0.0,doi:10.4232/1.13511
- Holford TR. Understanding the effects of age, period, and cohort on incidence and mortality rates. Annu Rev Public Health. 1991;12:425-57. doi: 10.1146/annurev.pu.12.050191.002233. PMID: 2049144.
