In an earlier post, I examined excess mortality in the USA and its causes in the covid period in comparison with a group of the five largest European countries: Germany, France, Italy, Spain and the United Kingdom (“Europe 5”). Data is now available for 2023 for all these countries except Australia, and I have updated my analysis to see whether life expectancy has caught up to pre-pandemic levels and whether the USA has continued to lag behind the Europe 5.
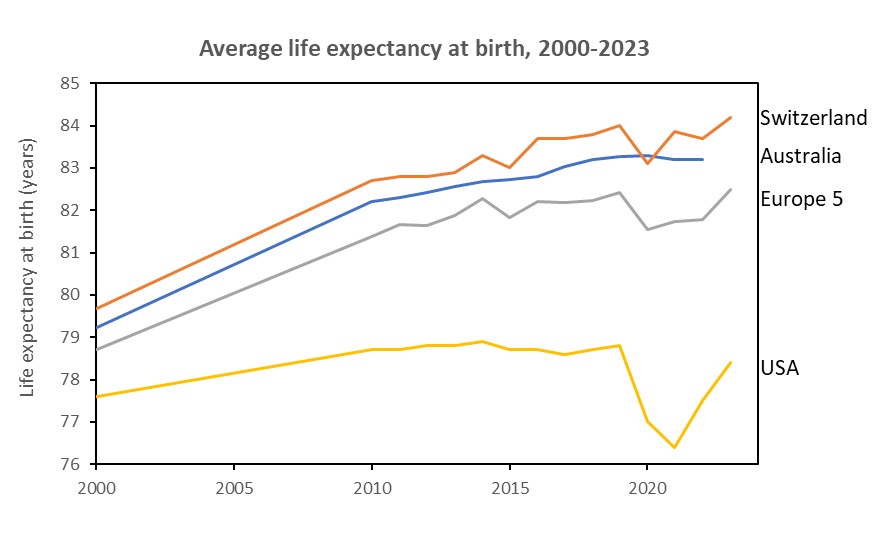
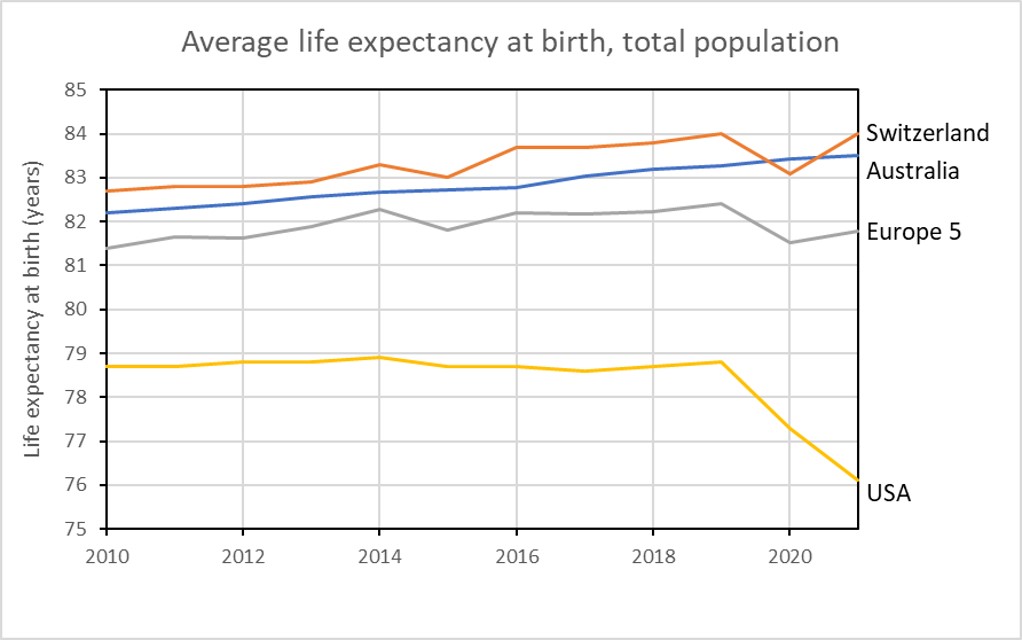
Life expectancy at birth in Switzerland and the Europe 5 has now rebounded to pre-pandemic levels. The USA, worse hit by covid, has also rebounded, but has not yet returned to pre-covid levels. Life expectancy at birth in the USA reached 78.4 years in 2023, 4.1 years behind the Europe 5 with life expectancy at birth of 82.5 years. A previous analysis found a life expectancy difference between red (republic-voting) and blue (democrat voting) states in the USA of 4.3 years.
I combined data on a population-weighted basis for five large European countries (labelled Europe 5 in the graph above) to create a composite, whose combined population size is very similar to that of the United States. Grouping these larger European countries to provide a mortality standard also creates a larger and more diverse population for comparison with the USA. Comparison with single smaller countries may be confounded by difference in various factors affecting mortality such as climate, diet, social history, and healthcare delivery.
I include data for Switzerland and Australia and have also included them in the graph below. Why? Because these are the two countries I have lived in for substantial parts of my life, and also are two countries with very high life expectancies. in the top 10 countries globally.
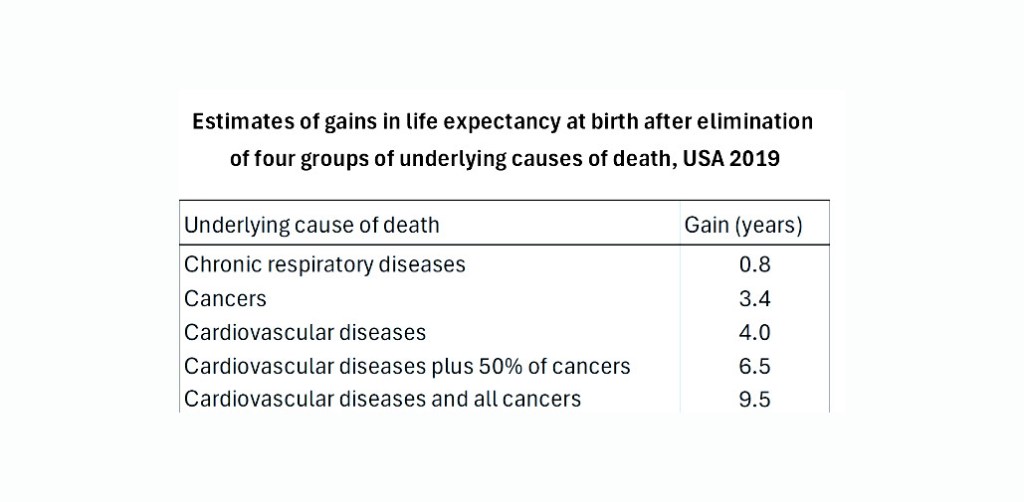
These differences may not seem particularly large, so I have put them into context by doing some disease elimination calculations for the USA. Using the USA national life table for the year 2019 together with estimates of the cause of death distributions by age and sex for the USA in 2019 (taken from the IHME GBD2019 study data available here), I estimated the increase in US life expectancy resulting from the elimination of deaths for particular causes across all age groups. The results are summarized in the table below for selected causes.
Complete elimination of all deaths due to cancer at all ages would increase US life expectancy at birth by 3.4 years- Complete elimination of cardiovascular diseases (heart disease, strokes, etc) would increase US life expectancy by 4.0 years, not quite enough to raise US life expectancy to that of the population of the Europe 5 countries in 2023. To raise the US life expectancy to that of Switzerland in 2023 would require eliminating all cardiovascular disease deaths plus around 30-40% of cancer deaths. That would amount to eliminating nearly 60% of all US deaths.
It might seem surprising that the elimination of 60% of deaths would result in “only” a 6.5 year increase in life expectancy. This is because in countries with high life expectancies, the vast majority of deaths occur at older ages where the age-specific death rate is rising almost exponentially. A large reduction in an age-specific death rate thus means that the age cohort only needs to live another six or seven years before their death rate reaches the same level as it was at the earlier age prior to the disease elimination.
The major factors causing the US life expectancy to be so far behind the average for Europe 5 are largely the same as those I identified in an earlier post: overweight and obesity, drug use and overdose, suicide, homicide, and lack of health insurance. Covid was also an important contributor to the difference in 2020 and 2021.
My involvement in global health statistics and summary measures of population health began back in 1991 when I first calculated disability-free life expectancy (DFLE) for Australia and presented the results at the 4th meeting of the International Network on Healthy Life Expectancy (REVES), in Leyden, Holland, in June 1991.
I joined WHO in early 2000 to work with Chris Murray and others on global burden of disease and other summary measures of population health. My engagement with international statistics on child mortality began around 2003 with efforts to get UNICEF and WHO to collaborate on producing consistent annual estimates of child mortality for all UN Member States. This led to the formation of the UN Interagency Group for Child Mortality (UN-IGME) in 2004 and I was a member of it until 2018 when I retired and joined its Technical Advisory Group (IGME-TAG).
I recently stepped down from the UN-IGME Technical Advisory Group and have now finally ended all my consulting work. It’s time for others still heavily engaged in the subject matter to take it on. But my work lives on, at least for a while. According to a recent analysis of Elsevier’s SCOPUS citation database, my total career citations put me at rank 7031 in the world, putting me in the top 0.04% of the 19 million scientists with citations in SCOPUS.
This August 2024 analysis of the SCOPUS database assessed a number of metrics for total and annual citations including a composite indicator (c-score). Results and rankings for the top 100,000 scientists by c-score, and for another 117,000 scientists who fell in the top 2 percentiles within their research sub-field, have been publicly released by JPA Ionnaidis (see here).
Scopus is a comprehensive database for peer-reviewed literature produced by Elsevier (www.elsevier.com/solutions/scopus). It covers articles from 1966 to present and fully covers Web of Science, MEDLINE, EMBASE, and ScienceDirect. SCOPUS contains over 80 million scientific publications. There were 19 million author profiles in SCOPUS in July 2024. So the 217,097 highly cited authors based on career publications in their career represent 1.15% of all scientists in SCOPUS.
My rank based on career citations to the end of 2023 (excluding self-citations) is 7031 which puts me in the top 0.04% of all scientists. Based on my citations in 2023 alone, five years after I retired. I am ranked 2,881 putting me in the top 0.015% of scientists for 2023.
In my principal subfield “General and internal medicine” there are 6987 highly cited scientists, representing approximately 2% of the scientists in this subfield. I am ranked 113th in the subfield, putting me in the 2% of the 2% who are highly cited.
Clarivate Analytics also publishes lists of highly cited scientists by research field based on citations in the Web of Science database. The latest published list is for 2023 and 2024 rsults will be released in December. I have been included in the Web of Science lists of the most highly cited researchers in the field of medicine from 2014 to the present. The lists of around 400 researchers are based on the number of highly cited papers (in the top 1% of citations over the previous decade) in the field, according to the Web of Science.
According to Google Scholar, my H index is 119 and total citations of my publications are more than 229,000 as of November 2024.
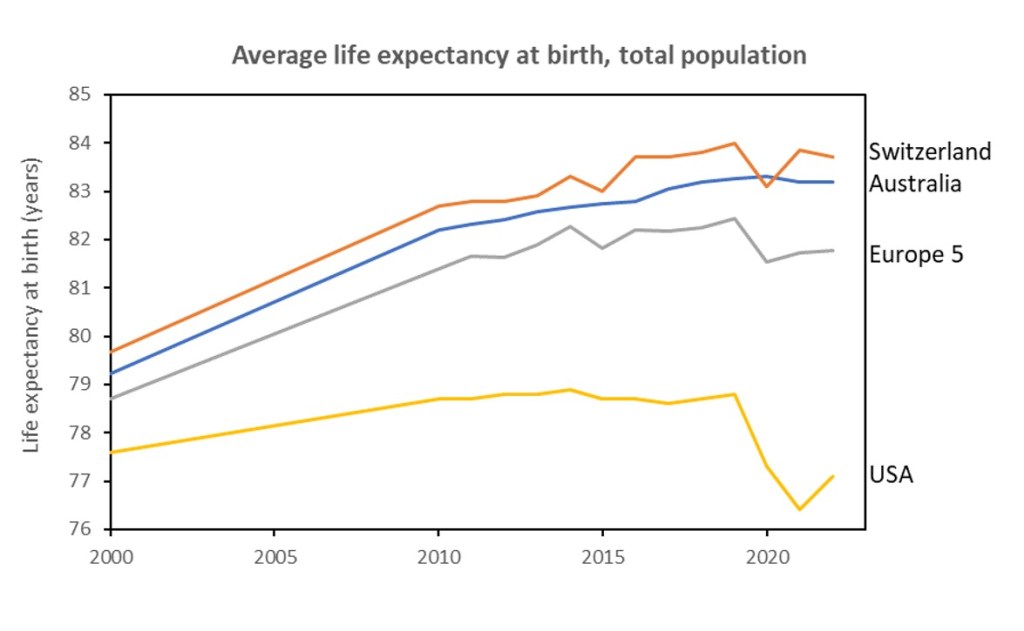
In an earlier post, I examined excess mortality in the USA and its causes in the covid period in comparison with a group of the five largest European countries: Germany, France, Italy, Spain and the United Kingdom (“Europe 5”). Based on data for the period 2010-2021, I examined trends in life expectancy at birth for the USA, Switzerland, Australia and a combined group of five European countries. I found that life expectancy at birth in the USA in 2021 was nearly 8 years lower than that for Australia and Switzerland, and 6 years lower than that for the five largest European countries. Additionally, the USA showed a continued decling in life expectancy from 2020 to 2021 whereas Switzerland and the Europe 5 showed an increase from 2020 to 2021 likely associated with the availability of covid vaccines. Data for these countries is now available for 2022, and I have updated my analysis to see what has happened.
The USA now also shows the beginnings of a rebound in life expectancy in 2022, though it is nowhere close to the 2019 life expectancy yet. US life expectancy in 2022 was 4.7 years lower than that for Europe5, 6.1 years lower than Australia, and 6.6 year lower than Switzerland.
I combined data on a population-weighted basis for five large European countries (labelled Europe 5 in the graph above) to create a composite, whose combined population size is very similar to that of the United States. Grouping these larger European countries to provide a mortality standard also creates a larger and more diverse population for comparison with the USA. Comparison with single smaller countries may be confounded by difference in various factors affecting mortality such as climate, diet, social history, and healthcare delivery.
I include data for Switzerland and Australia and have also included them in the graph below. Why? Because these are the two countries I have lived in for substantial parts of my life, and also are two countries with very high life expectancies in the top 10 countries globally.
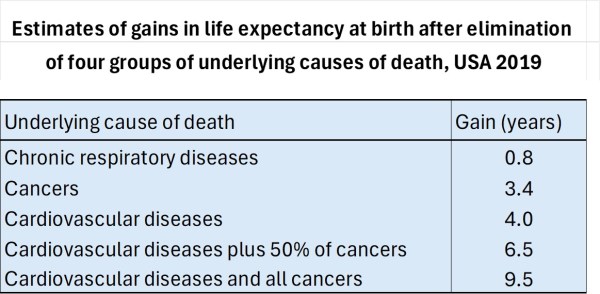
These differences may not seem particularly large to many so I have put them into context by doing some disease elimination calculations for the USA. Using the USA national life table for the year 2019 together with estimates of the cause of death distributions by age and sex for the USA in 2019 (taken from the IHME GBD2019 study data available here), I estimated the increase in US life ex, not quite pectancy resulting from the elimination of deaths for particular causes across all age groups. The results are summarized in the table below for selected causes.
Complete elimination of all deaths due to cancer at all ages would increase US life expectancy at birth by 3.4 years- Complete elimination of cardiovascular diseases (heart disease, strokes, etc) would increase US life expectancy by 4.0 years, not quite enough to raise US life expectancy to that of the population of the Europe 5 countries in 2022. To raise the US life expectancy to that of Switzerland in 2022 would require eliminating all cardiovascular disease deaths plus 50% of cancer deaths. That would amount to eliminating nearly 60% of all US deaths.
It might seem surprising that the elimination of 60% of deaths would result in “only” a 6.5 year increase in life expectancy. This is because in countries with high life expectancies, the vast majority of deaths occur at older ages where the age-specific death rate is rising almost exponentially. A large reduction in an age-specific death rate thus means that the age cohort only needs to live another six or seven years before their death rate reaches the same level as it was at the earlier age prior to the disease elimination.
The reasons for the US life expectancy being so far behind the average for Europe5 are largely the same as those I identified in my previous post: overweight and obesity, drug use and overdose, suicide, homicide, and lack of health insurance. Covid has become less important but overdose deaths have increased substantially since 2020.
A new and highly transmissible subvariant of the Omicron Covid18 variant, XBB.1.5, also nicknamed the Kraken, was first identified in the USA in late October 2022. At the beginning of December, Omicron sub variant XBB.1.5 made up just 1.3 per cent of all COVID-19 cases in the U.S. By the week ending 10 February 2023, XBB.1.5 made up an estimated 75% of cases in the USA. Although XBB.1.5 is around 12% more transmissible than over forms of Omicron, there is no evidence that it is any more severe than other forms of Omicron.
As of 15 February 2023, there were 1,309 named variants and subvariants of Covid-19 listed in the PANGO database and some scientists have started to use nicknames from mythology to make it easier to talk about variants of public interest. XBB.1.1.5 has been given the nickname Kraken, a sea-monster from Norse mythology. Other Omicron subvariants deemed worthy of a name include BA.2.20 (the Basilisk), XBB.1 (the Hippogryph) and BF.7 (the Minotaur). Other Covid experts have objected to the use of these nicknames, and the Kraken in particular, saying it will cause unnecessary fear in the general public.
The Kraken (XBB.1.5) descends from XBB (the Gryphon), which emerged in the spring or summer last year, possibly in India. The Gryphon was the product of two different forms of Omicron that both infected someone. As they were replicating inside that person, their genes were mixed together, and then we got a new hybrid. And this hybrid is very good at evading defences from vaccines and infections.
So it caused a big surge in Singapore in the fall, but it didn’t really become that common elsewhere because it was competing with so many other subvariants. But as it multiplied, it started gaining more mutations. So XBB gave rise to XBB.1, and then XBB.1 mutated again into XBB.1.5. And it looks like XBB.1.5 gained a really crucial mutation in the spike protein, which makes it more transmissible on top of doing a better job of escaping antibodies.
Preliminary studies indicate that the Kraken has very limited susceptibility to vaccine antibodies from the original mRNA vaccines and boosters. The protection given by bivalent boosters (second generation vaccines, which became available around October last year] is better. Preliminary studies suggested protection was reduced relative to other Omicron variants – some estimating the efficacy was only 30 per cent or less. However, the first study to specifically compare bivalent protection against the Kraken with protection against other Omicron variants found that it almost equally protective.
Compared to those who received 2-3 monovalent doses only, the bivalent vaccine effectiveness was 43% against Omicron and 40% effective against Kraken in 50-64 year olds – this difference was not statistically significant. A vaccine effectiveness of 40% means that the vaccine reduces the risk of infection by 40% (in this case compared to those with monovalent vaccinations). The bivalent effectiveness in those over 65 was similar to those 50-64 and not statistically different between Kraken and other Omicron. The bivalent effectiveness was even higher in those under 50, at around 50%.
Findings from this study suggest that bivalent booster doses are continuing to provide additional protection against symptomatic infection by Kraken similar to that for other Omicron, for at least the first 3 months, after vaccination in persons who had previously received 2, 3, or 4 monovalent vaccine doses. Its definitely worth getting the bivalent booster!
However, while XBB.1.5 has reduced vaccine protection against infection (and developing symptoms and long COVID), vaccines “still remain effective against severe disease”, according to the ECDC.
* The Kraken Wakes is the title of an apocalyptic science fiction novel by John Wyndham, first published in the UK in 1953. It describes the invasion of earth by aliens who can only survive in the deepest parts of the ocean. Wyndham was one of my favourite SF authors when I was a teenager and is best known for another apocalyptic SF novel, the Day of the Triffids, in which humanity is almost wiped out by a carnivorous plant species.
Omicron and subvariants have become the dominant form of Covid-19 circulating in most parts of the world. So-called bivalent mRNA vaccines became available from both Pfizer and Moderna in August or September 2022. Intended for booster vaccination, they contain mRNA both for the spike protein of the original Wuhan strain and for that of the Omicron variants BA.4 and BA.5. It was hoped these would provide additional immunity against Omicron variants, as the early trials promised.
The Swiss government made the bivalent booster available free of charge to everyone aged 16 and over and I was boosted (for the third time) with it on 5 December, just over 5 months after my previous booster. A study published by CDC in November 2022 found that the bivalent booster provided significant additional protection against symptomatic covid infection in people who had had from 2 to 4 previous monovalent vaccinations. Another study published in NEJM found that the booster was effective at reducing hospitalization from severe omicron infection by 60% (NEJM)
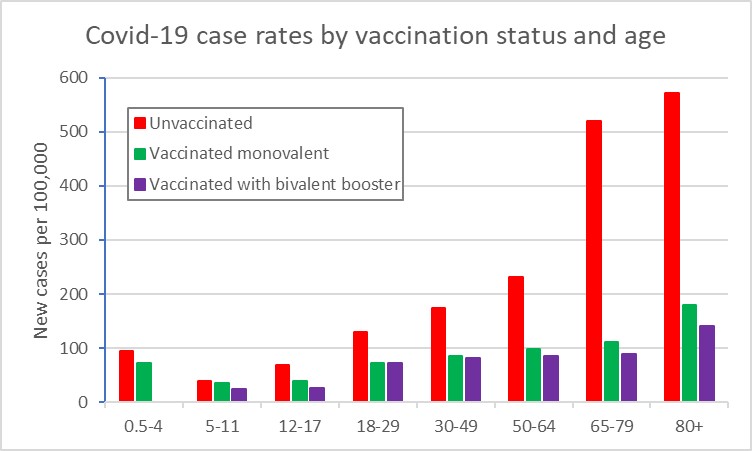
So I was surprised to come across another perspective published in NEJM which quoted research finding no significant difference in the immune response elicited by monovalent and bivalent vaccines and arguing that the bivalent booster should be reserved for older adults and high risk groups. I took a closer look at the benefits of the bivalent booster using data from the CDC COVID Tracker on rates of COVID-19 cases and deaths by vaccinations status.
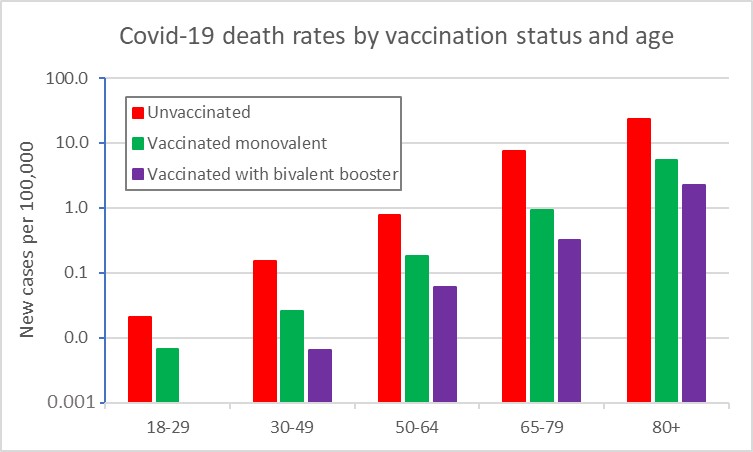
I aggregated data on cases detected in the nearly 3-month period from 1 October to end of third week of December 2022, and calculated average case and death rates by vaccination status and age group. The first figure shows case rates and the second death rates by vaccination status. Note that the death rates are plotted on a logarithmic scale. The bivalent booster provides additional protection against infection mainly for the older age groups from 50 onwards. It provides a substantial additional protection against death across all age groups from 30 onwards, although death rates are much lower for 30-49 than for 50 and over.
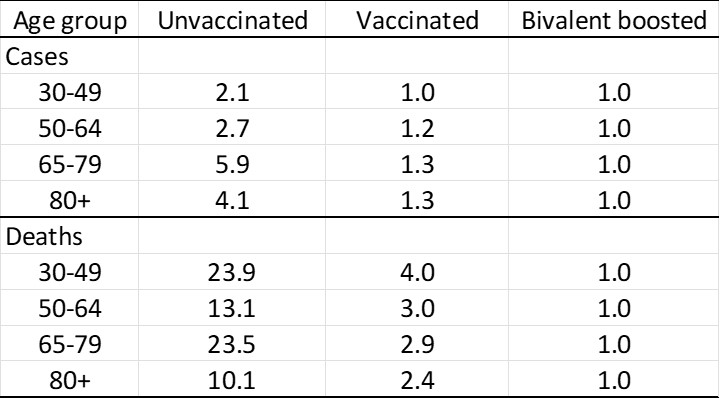
The following table compares the relative risk of infection and death for the unvaccinated and the monovalent vaccinated compared to the bivalent boosted as the standard:
For my age group, the bivalent booster reduces the risk of infection to 1/6th and the risk of death to nearly 1/24th that of the unvaccinated. It reduces my risk of infection by 25% compared to the monovalent vaccinated, and the risk of death to one-third that of the monovalent vaccinated. Seems worthwhile additional protection to me.
In my previous post, I highlighted the 3-year drop in US life expectancy from 2019 to 2021. It contrasts with European and other high-income countries where the availability of vaccines and continued implementation of other public health measures resulted in an increase in life expectancy in 2021 after the Covid-related 1-year drop in 2020.
A World Health Organization (WHO) expert group has estimated excess deaths by country and month during the pandemic years 2020 and 2021. The plot below compares excess death rates for the USA with those for the aggregate of the five largest European countries: Germany, France, Italy, Spain and the United Kingdom (“Europe 5”).
Unlike Europe, the USA had an excess death rate in the second half of each year that was around double the death rate in the first half of the year. Covid-19 vaccines became generally available in Europe in early 2021 and in the USA around April 2021. The much higher death rate in the USA in the second half of 2021 is likely associated with slower and lower uptake of vaccination.
The Seattle-based Institute for Health Metrics and Evaluation (IHME) has also estimated excess deaths by country for the period 2020-2021 compared with 2019. I used their estimates for US states (available here) to examine the differences in excess deaths associated with higher and lower vaccination rates and with support for the Republican candidate in the 2020 presidential election.
I sorted US states into ascending order of the per cent of the total state-level votes for Trump and Biden in the 2020 presidential election that were votes for Trump. I then grouped the sorted states into three groups (tertiles) of roughly equal populations. I similarly produced tertiles of states sorted in descending order according to the per cent of the population fully vaccinated in August 2022.
The following plot shows a scatterplot of US states vaccination status versus per cent voting for Trump. Ignoring the outlier point with 5.5% voting for Trump (District of Columbia), these two variables are strongly correlated across states, with a correlation coefficient of -0.87.
IHME estimates of excess deaths for 2020-2021 by state were grouped into voting tertiles and vaccination tertiles, and the excess death rates per 100,000 population are shown in the Table below. If the second and third tertiles had had the excess death rate of the first tertile, there would have been 141,000 fewer deaths (based on voting tertiles) or 152,000 fewer deaths based vaccination tertiles. The numbers are quite similar when states are grouped by vaccination or voting behaviour, reflecting the close correlation between voting behaviour and vaccination levels.
While the evidence I’ve reviewed above linking political partisanship and covid-19 deaths is based on group-level correlation, which by does not necessarily imply causation, in this case the conclusion seems obvious. Fortunately, we now have a study which took 577,659 death records from Ohio and Florida between January 2018 and December 2021 and matched the deaths to a 2017 voter file. In other words, they were able to identify the partisanship not only of the places those people lived but of the people themselves. The plot below shows the excess death rates according to the political affiliations of the people who died. The first solid vertical line marks the time of the beginning of pandemic in the USA and the second solid line shows the point at which all adults became eligible for covid vaccines.
The death rate was a little higher for Republicans in 2020, but started to diverge substantially after vaccines became generally available. The well-documented differences in vaccine attitudes and uptake between Republicans and Democrats directly resulted in higher excess deaths among Republicans.
Extract from Figure 1 of Jacob Wallace, Paul Goldsmith-Pinkham, Jason Schwartz (2022). Excess death rates for Republicans and Democrats during the COVID-19 pandemic. https://arxiv.org/abs/2209.10751, submitted 23 Sep 2022.
Complete state-level data on deaths by age and sex for 2021 are not yet available, but I have used GBD2019 estimates of US state death rates by age and sex (IHME 2020) together with CDC information on state-level deaths up to 2020 and cause-specific increases in deaths in 2021 to impute the age-sex specific deaths data needed to compute average life expectancy at birth by US voting tertiles. The estimated life expectancies for the 1st voting tertile (labelled USA-Dem) and the 3rd voting tertile (labelled USA-Rep) are included in the graph below. The curve for the 2nd tertile is not shown as it is quite close to the line on the graph for the USA as a whole.
The gap between the 1st and 3rd tertiles widened from just under 2 years in 2000 to 3 years by 2014. This gap was fairly stable at 3.2 years in 2018 and 2019 and only widened by 0.1 year in 2020. However, in 2022, when vaccines became available it jumped to 4.1 years.
Another recent paper has looked at the difference between the most-vaccinated and least-vaccinated states for the more recent period of June 2021 to March 2022. The table below compares the 10 most-vaccinated states and the 10 least-vaccinated states with the overall USA covid-19 mortality and that for Europe-5, Australia and Switzerland. Total covid-19 mortality in the least-vaccinated states was three times higher than in the most-vaccinated states and US covid-mortality overall was 2.7 times higher than for the Europe-5 countries.
The final columns of the table show the potential covid deaths that the full USA would have averted if it had had covid-19 death rate of the specified country/states during the period of interest. Whether it is assumed the USA could have had the excess covid death rate of the 10 most vaccinated states or the Europe-5 countries, the potential deaths averted would have been close to 300,000.
Putting together this analysis with my earlier analysis for the period 2020-2021, it seems reasonably to conclude that differences in vaccine uptake due to political partisanship have likely cost the USA at least 350,000 additional covid-19 deaths to date than would have otherwise occurred.
US life expectancy dropped nearly 3 years during the first two years of the Covid-19 pandemic. The CDC has recently released US life expectancy estimates for 2021, finding a significant drop for the second year in a row. That decline – 77.0 to 76.1 years – took U.S. life expectancy at birth to its lowest level since 1996. The 2.7 year drop in life expectancy in 2020 – 2021 was the biggest two-year decline in life expectancy since 1921-1923.
I did a quick comparison with the UN Population Division’s latest estimates of life expectancy at birth in 2019, the last year before the pandemic (see World Population Prospects 2022). Countries with similar life expectancies around 76.0 to 76.2 included Tunisia, Sri Lanka, Jordan, Iran and Peru.
In an earlier post, I examined excess mortality in the USA and its causes in the period 2000-2020 in comparison with a group of the five largest European countries: Germany, France, Italy, Spain and the United Kingdom (“Europe 5”). I found data for these countries and the USA for trends in life expectancy at birth (both sexes combined) for the period 2010-2021 from the EU, CDC, and UK national statistics. I also found data for Switzerland and Australia and have also included them in the graph below. Why? Because these are the two countries I have lived in for substantial parts of my life, and also are two countries with very high life expectancies (2nd and 8th among WHO Member States).
Switzerland and Europe 5 both show a drop in life expectancy of a little under 1 year in 2020, followed by an increase in 2021, likely associated with the availability of covid vaccines and some improvements in treatment. Australia showed no visible impact of covid on the continued increase in life expectancy at birth. Studies of excess mortality in the covid period have found that Australia is one of the few countries where covid deaths were more than outweighed by reductions in causes of death such as seasonal flu and road injury associated with the lockdowns and social distancing.
In contrast, the USA has shown no improvement in 2021 but continued decline in life expectancy. Around half of this decline is due to the higher covid death rates in the USA, associated with political polarization around covid strategies, treatments and vaccination. I will examine the evidence for this in a following post. But other causes also contributed to this decline, particularly a continuing increase in drug overdose deaths (exceeding 100,000 deaths in 2021), heart disease (reflecting high levels of obesity), chronic liver disease (mainly due to alcohol), suicides and homicides. Life expectancy at birth in the USA in 2021 was nearly 8 years lower than that for Australia and Switzerland, and 6 years lower than that for the five largest European countries. These differences in life expectancy represent a massive difference in death rates. To put them in perspective, the complete elimination of cancer deaths in the USA would add around 4 years to life expectancy at birth for men and 3 years for women.
In my previous post, I estimated that 47% of pregnancies are unintended, and of these, 43% occur in countries where abortion is illegal or severely restricted. Globally, 60% of unintended pregnancies are aborted. In countries where abortion is widely available, 71% of unintended pregnancies are aborted compared to 46% in countries with severe restrictions.
The World Health Organization (WHO) estimates that around one-third of the 23 million induced abortions carried out each year in countries where abortion is severely restricted are performed under the least safe conditions, by untrained persons using dangerous and invasive methods. Safe abortion is an essential health care service. It is a simple intervention that can be effectively managed by a wide range of health workers using medication or a surgical procedure. In the first 12 weeks of pregnancy, a medical abortion can also be safely self-managed by the pregnant person at home.
I’ve been involved in the estimation of global deaths due to maternal mortality for WHO and UNICEF since the early 2000s. WHO defines maternal mortality as death while pregnant or within 42 days of the end of pregnancy from any cause related to or aggravated by the pregnancy or its management, but not from accidental or incidental causes. This measure is reported by WHO and UNICEF as a maternal mortality ratio per 100,000 births (MMR) for international comparisons and monitoring.
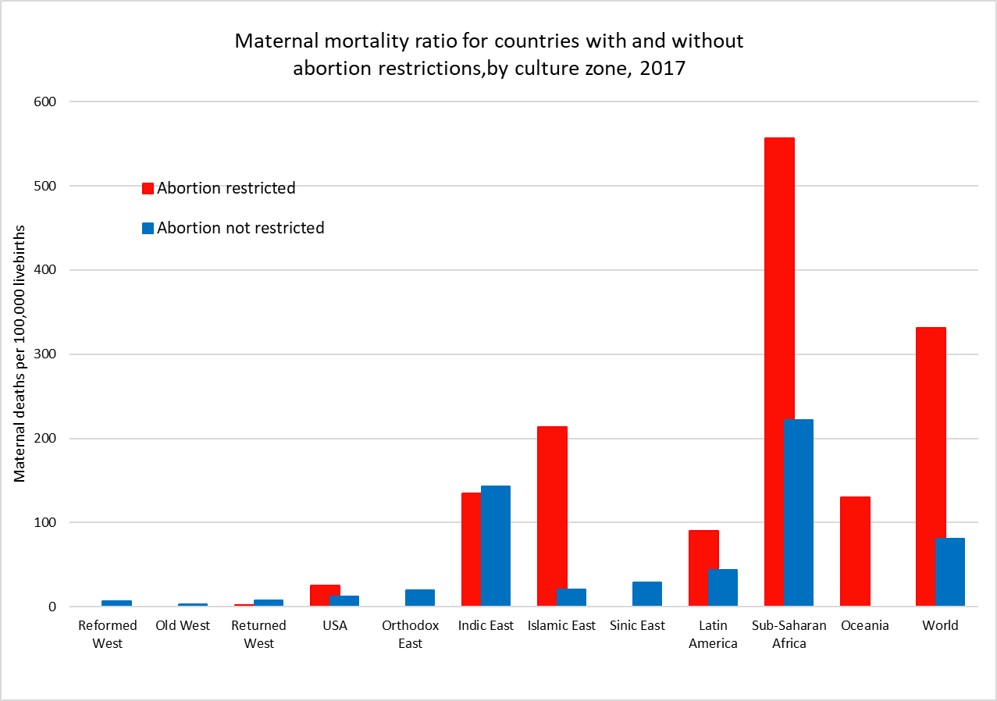
The following plot shows average MMR for countries grouped by access to abortion and country zone for the year 2017. US states have been grouped according to abortion restrictions and state-level MMR estimates from GBD2019 used and adjusted to match the national average MMR reported by CDC. Only one country, Poland, in the three “West” culture zones restricts abortion and it has an apparently very low MMR. While countries that restrict abortion have higher MMRs than those that don’t for most of the culture zones, we cannot conclude that abortion restriction per se is responsible for the difference. Abortion restriction is also correlated with other determinants of higher MMR such as lower average income per capita, less access to health care, and higher levels of discrimination against women.
The global MMR has declined from 345 per 100,000 livebirths in 2000 to 212 per 100,000 livebirths in 2017, a 40% decrease in 17 years. There have been substantial declines in MMR in every culture zone except for the Reformed West and Old West where MMR rates were already very low in 2000 and in the USA where rates have risen substantially during the 21st century. The plot below takes a closer look at MMR trends in the USA, the Reformed and Old West, the Returned West and the Orthodox East. The latter two culture zones include the former Soviet bloc countries. With the exception of Poland in the Returned West, all these culture zones except the USA do not restrict access to abortion services and allow abortion on request or in some countries on “economic and social grounds”.
WHO/UNICEF estimates of MMR have been extended forward to 2019 using trend estimates from GBD2019. The US MMR estimates have been adjusted for consistency with CDC statistics on MMR for years 2000 to 2020. The maternal mortality ratio for the USA has increased from around 15 per 100,000 livebirths in 2000 to 23.8 in 2020, a 62% increase. Abortion rates in States which now restrict abortion were similar to those in states which don’t until 2008 and afterwards diverged substantially. The rate for states with restrictions was 26.4 in 2020, 30% higher than the MMR of 20.2 for states without restrictions.
There has been considerable controversy about the substantial increase in maternal mortality in the USA, particularly as to whether it is associated with improvements in the identification and reporting of maternal deaths. Identification of pregnancy-related deaths has improved over time due to the use of computerized data linkages between birth and death records, and the addition of a pregnancy checkbox to death records from 2003 onwards. This checkbox is thought to have led to some increase in estimated MMRs in the early 2000s, but several studies have also identified that increasing restrictions on the general availability of reproductive health services have played a major role in the substantial increase in maternal mortality seen in the USA, particularly in states restricting access to abortion.
Hawkins et al (2019) found that a 20% reduction in the numbers of Planned Parenthood clinics resulted in an 8% increase in maternal mortality and states that enacted legislation to restrict abortions based on gestational age increased the maternal mortality rate by 38%.
A 2020 study by the Commonwealth Fund compared maternity care in the USA with 10 other developed countries and found that the USA has the highest maternal mortality among developed countries and that there is an overall shortage of maternity care providers (obstetrician-gynecologists and midwives). The USA has 12 to 15 providers per 1,000 livebirths, and all the other developed countries have a supply that is between two and six times greater. Although a large share of its maternal deaths occur postbirth, the U.S. is the only country not to guarantee access to provider home visits or paid parental leave in the postpartum period.
In the first five or so years I was at WHO, I worked with a maternal health colleague who provided estimates of deaths due to unsafe abortions using very uncertain estimates of the numbers of unsafe abortions and literature reviews of studies of death rates associated with unsafe abortion. Unsafe abortion was estimated to account for around 13% of total global maternal deaths, which were then estimated to be around half a million deaths per year at the beginning of the 21st century.
A more recent study by WHO staff and academic colleagues in 2014 estimated that abortion accounted for 7.9% of maternal deaths at global level between 2003 and 2009 (with uncertainty range 4.7 to 13.2%). An estimated 287 000 maternal deaths occurred worldwide in 2010, most of which were in low-income and middle-income countries and were avoidable. This would suggest there were around 22,700 maternal deaths per year associated with abortion.
Recent WHO estimates for global deaths by cause do not include deaths due to induced abortion. The IHME Global Burden of Disease Study 2019 has produced estimates of maternal deaths due to abortion and miscarriage for the period 1980 to 2019. These would also include induced abortion deaths as well as deaths due to spontaneous abortions and miscarriages.
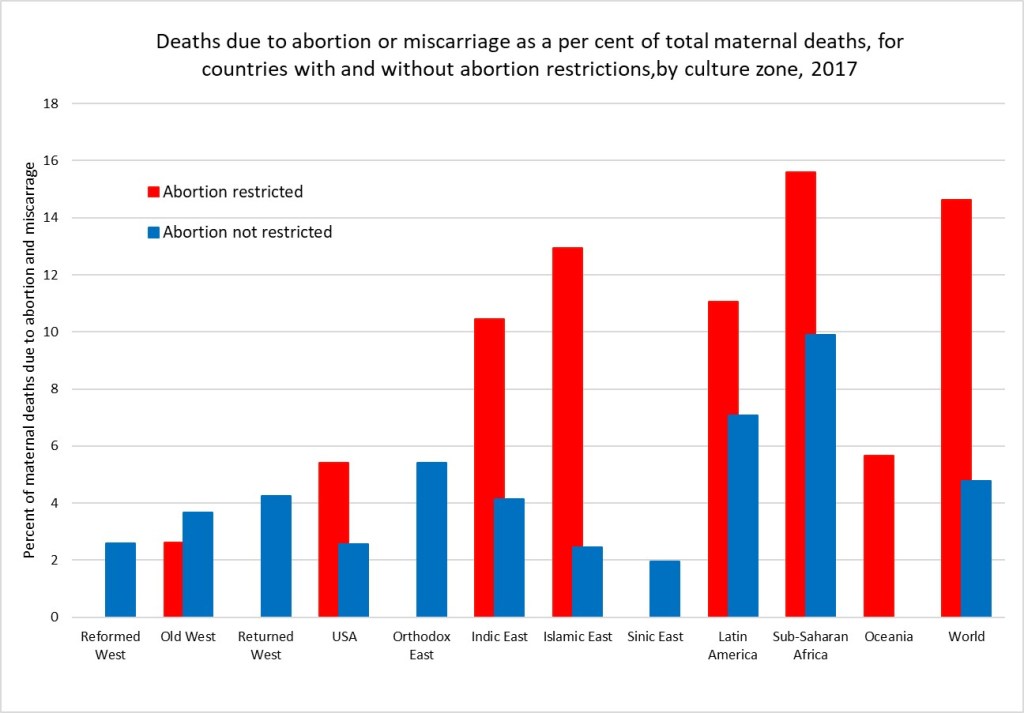
I have used IHME GBD estimates of the proportion of maternal deaths that are due to abortion and miscarriage to impute estimates for these deaths consistent with the latest available WHO/UNICEF estimates of maternal deaths for all countries for the year 2017. The figure below shows the average percent of maternal deaths attributed to abortion and miscarriage for countries with and without abortion restrictions in each culture zone.
Overall, I estimate that there were 75,500 deaths globally due to abortion and miscarriage in 2017 (these include spontaneous events as well as induced abortions). Of these 70,300 were in countries with abortion restrictions. I’ve done a very back of the envelope approximation of the abortion deaths that might be attributable to unsafe abortion by making the big assumption that the percent of deaths due to spontaneous abortion and miscarriage are the same as those for the countries in the region for which abortion access is not restricted. The excess deaths are then attributed to unsafe abortion. I estimate that abortion restrictions resulting in unsafe abortions caused 54,350 deaths in 2017. If all abortions were safe, there would have been only 21,200 deaths due to spontaneous abortion and miscarriage in 2017.
At global level, 4.8 per cent of maternal deaths are classified as due to abortion or miscarriage (spontaneous or induced) In countries without abortion restrictions and 14.6% in countries with restrictions. Adjusting to removed estimated spontaneous events, I estimate that 6.9% of maternal deaths in countries with abortion restrictions are due to unsafe abortion. Its quite possible these very back-of-the-envelope estimates are under-estimates. Classification of maternal deaths due to abortion, and more specifically unsafe abortion, is associated with a risk of misclassification. Even where induced abortion is legal, religious and cultural perceptions in many countries mean that women do not disclose abortion attempts and relatives or health-care professionals do not report deaths as such. Under-registration of deaths might be the result of stigmatisation of abortion affecting what information is reported by relatives and informants or intentional misclassification by providers when abortion is restricted. In these circumstances, the overall number of maternal mortality might not be affected, whereas abortion-related deaths might be significantly underestimated because of this under-reporting.
A little under two months ago, the Guttmacher Institute and WHO released first-ever country-level estimates of unintended pregnancy and abortion (see here). The new study analyzed data for 150 countries for the period 2015-2019 and found that:
Almost half of the 220 million pregnancies globally per year are unintended.
Six in 10 unintended pregnancies end in an induced abortion (63 million per year).
Overall, 29% of all pregnancies globally end in an induced abortion.
Almost 30% of induced abortions occur in countries where abortion is either illegal or heavily restricted. Earlier estimates for 2010-2014 found that 45% of all abortions are unsafe, and around 15% were performed in the least safe conditions, by untrained persons using dangerous and invasive techniques.
Regional averages mask large disparities within regions for unintended pregnancy and abortion rates.
The Guttmacher/WHO study covers 90% of the 1.9 billion women of reproductive age. Almost all the missing countries (because of lack of data) are from the Western Asia and Northern Africa region, most of them Islamic states or with a dominant Islamic culture. I describe below how I imputed data for most of the missing countries, added data on legal grounds and restrictions regarding abortion and examine global patterns using 12 culture zones which group countries based on history, values and religion.
The following plots give a taste of the global patterns I found. Culture zone and other definitions, data and methods are given in more detail in the rest of this post.
Figure 1.
Figure 2.
*Note that USA results have been calculated by grouping States into those with and without significant abortion restrictions
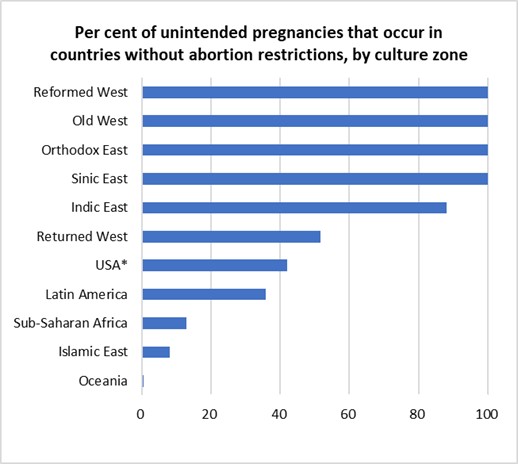
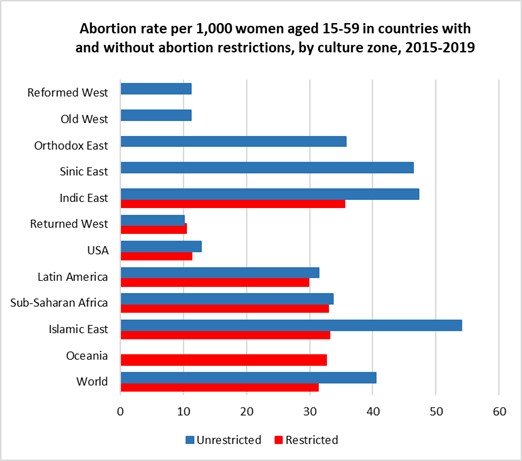
The left-hand figure shows that abortion is universally legally available in most of Europe, Canada, Australia and New Zealand, in the Orthodox and Islamic countries of the former Soviet-bloc and in the non-Islamic countries of Asia. It is legally severely restricted in most Islamic countries and sub-Saharan Africa. Abortion rates are substantially lower in the high-income countries of Europe, North America and Australia and New Zealand than in the Asian regions where abortion is unrestricted AND in the countries in all developing regions irrespective of whether abortion is legally restricted or available. Note that USA results have been calculated by grouping States into those with and without significant abortion restrictions.
For 2015-2019, almost half of unintended pregnancies (46%) were aborted in countries where abortion was restricted (often severely) and a little over two-thirds (70%) in countries where abortion is accessible. In the three regions where around 40-50% of women with unintended pregnancies have restricted access to abortions, overall abortion rates per 1,000 women of reproductive age differ by less than 2 abortions per 1,000 from those in countries (or US states) without restrictions.
Imputation of data for countries in Western Asia and Northern Africa
The 150 countries with abortion-related data represent 90% of the 1.9 billion women of reproductive age 15-49 years in the period 2015-2019. Of the eight Sustainable Development Goals (SDG) regions used in the study, the coverage of reproductive-age women by countries with data fell below 95% only for Western Asia and Northern Africa, where data coverage was only 3.4%. However, the missing women are almost entirely in one SDG region, Western Asia and Northern Africa
The region includes 24 countries, mostly in North Africa and the Middle East. Data is available only for Azerbaijan, Armenia and Georgia. These are all former Soviet-bloc countries with legal abortion and high rates of termination of unintended pregnancies. In contrast, apart from Israel and Cyprus, the other 19 countries are all either explicitly Islamic states or with a predominant Islamic culture. Seventeen of the 19 either prohibit or severely restrict abortion.
To address the bias inherent in excluding these countries from global statistics, I decided to impute the unintentional pregnancy rates and abortion rates for the Islamic countries in North Africa and the Middle East and also for Afghanistan, Iran and Malaysia, using information on live birth rates for these countries along with the abortion data for 22 Islamic countries in the neighbouring regions Sub-Saharan Africa, South-central Africa and South-eastern Asia. Former Soviet-bloc Islamic countries were not included in this dataset.
Pregnancy rates were regressed against live birth rates for this dataset and the regression model (R-squared 0.91) used to predict pregnancy rates for the missing data. Unintended pregnancies are defined as pregnancies which were unwanted at the time they were conceived or occurred earlier than desired. Explorations of various covariates for predicting the proportion of pregnancies that are unintentional resulted in predicting of missing data using a regression on the log of GDP per capita measured in international (purchasing-power-parity adjusted) dollars and a continuous variable measuring average-religiosity for countries in 2017. Both these variables are significant predictors of the proportion of pregnancies that are unintentional and the regression on the prediction dataset has an R-squared of 0.52. I used previously estimated levels and trends in average religiosity (practicing, non-practicing, non-religious and atheist) for countries using data from the World Values Survey (WVS) and European Values Study (EVS) covering the period 1980 to 2020 (see previous post here).
The only predictive variable found for the proportion of unintentional pregnancies resulting in induced abortion was the gender inequality index produced by United Nations Development Program. Regression of logit(abortion fraction of unintended pregnancies) against the logit of the 2017 value of the gender inequality index was used to predict missing abortion fractions of unintended pregnancies (R-squared 0.7).
Global and regional abortion rates for 2015-2019
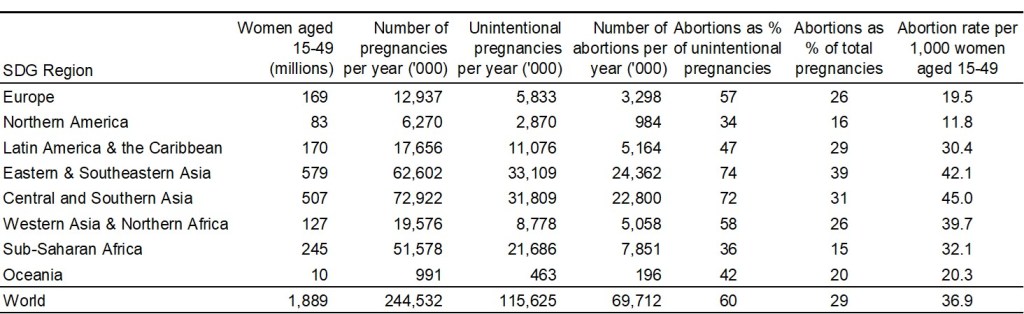
With these missing values imputed for 23 countries, the abortion estimates now cover most countries in most regions, and 98.6% of women of reproductive age globally. Based on this extended dataset, the following table summarizes regional and global patterns of pregnancy and abortion for the period 2015-2019.
The Guttmacher/WHO paper in the British Medical Journal displays unintended pregnancy and abortion rates by country for the 150 countries included in their study. The estimates dataset is available here. It includes 80% and 95% uncertainty intervals. In this post, I’m interested to see the big picture at regional and global level, and I’ve not done the additional work to estimate uncertainty intervals. But it is important to keep in mind that there are many problems with data availability, reliability and completeness of reporting, particularly for an often stigmatized and contentious issue such as abortion. So the broad patterns shown below likely convey a reasonable and evidence-based assessment, but small differences between countries or regions should not be over-interpreted.
Legal restrictions in countries and US States
The legality and acceptability of abortion varies widely across the world, from Europe where it is available without restriction in most countries, to the Middle East and Africa where it is largely illegal.
I’ve taken country-level information on abortion availability and restrictions from Wikipedia, which documents legal grounds on which abortion is permitted, and gestational age limits where relevant, using the following six categories: risk to life, risk to health, rape, fetal impairment, economic or social reasons, on request. The first four of these grounds cover a fairly small percentage of unintended pregnancies and I have grouped in a single category “restricted or prohibited” countries which allow abortion only on these grounds. Countries which allow abortions on economic or social grounds or on request (with any gestational age limit set at least 10 weeks or longer) are classified as “unrestricted”. The USA has widely varying legal restrictions on abortions across the 50 states and Washington DC. I have used information on abortion access from Planned Parenthood to classify abortion access as restricted (28 states) and unrestricted (22 states and Washington DC).
Revised culture groups for countries
In earlier posts, I analyzed religious and other values by culture groups for 110 countries using data from the World Values Surveys and the European Values Study. These culture zones were based on the 11 culture zones developed by Welzel (2013).
For this post, I’ve slightly revised the culture zones to group Canada with Australia and New Zealand in the “Reformed West” zone, and kept the USA as a single separate culture zone. I’ve also revised the categories “Indic East”, “Sinic East”, and Islamic East to group together all countries with a predominantly Islamic culture and values. The revised culture zones are as follows:
Reformed West — Western European societies strongly affected by the Reformation: Denmark, Finland, France, Germany, Iceland, Netherlands, Norway, Sweden, Switzerland, United Kingdom, plus Canada, Australia and New Zealand;
USA — The North American culture zone included only two countries, USA and Canada. Canada’s culture is very similar to the Reformed West, and it is moved there.
Old West — Mostly Catholic parts of Western Europe being core parts of the Roman Empire: Austria, Belgium, Cyprus, Greece, Ireland, Israel, Italy, Luxembourg, Malta, Portugal, Spain;
Returned West — Catholic and Protestant parts of post-communist Europe returning to the EU: Croatia, Czechia, Estonia, Hungary, Latvia, Lithuania, Poland, Slovakia, Slovenia;
Orthodox East — Christian Orthodox or Islamic parts of the post-communist world, mostly parts of former USSR;
Indic East — Parts of South and South East Asia under the historic influence of Indian or Buddhist culture: Bhutan, Cambodia, India, Laos, Malaysia, Myanmar, Nepal, Philippines, Singapore, Sri Lanka, Thailand, Timor-Leste;
Islamic East — Countries with predominantly Islamic religion and culture;
Sinic East — Parts of East Asia under the historic influence of Chinese culture and/or Buddhism: China, Japan, Mongolia, North Korea, South Korea, Taiwan, Vietnam;
Latin America — Central and South America and the Caribbean;
Sub-Saharan Africa — African countries south of the Sahara.
Oceania — Papua New Guinea and other Pacific Island countries.
Patterns of abortion by culture group
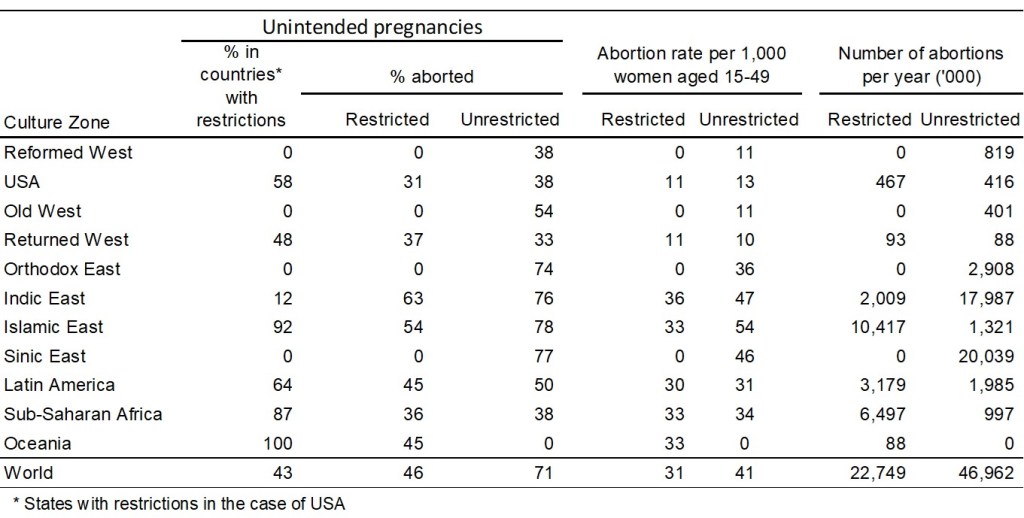
The table below summarizes the abortion situation for countries without legal restrictions and countries with legal restriction in each culture zone. Country-level legal status is used except for the USA where the statistics relate to two groups of states: those with and without legal restrictions on abortion (as defined above). State level estimates are not available for the per cent of unintended pregnancies, or the per cent that are aborted. I have assumed that the national percent of all pregnancies that are unintended (34%) is the same in the two groups of states, and that the % aborted in states without restrictions is the same (38%) as that in the Reformed West where abortion is 100% unrestricted. Since the national level of unintended pregnancies that are aborted is 34%, this implies that the proportion of unintended pregnancies aborted in states with restrictions is 31%.
To graphically illustrate these variations across culture zones, I repeat the two figures included near the beginning of this post:
Figure 1.
Figure 2.
Globally, 60% of unintended pregnancies ended in abortion in the period 2015-2019. People seek and obtain abortions in all countries, even in those with restrictive abortion laws, where barriers to safe abortion care are high. In fact, over the past three decades, the proportion of unintended pregnancies that end in abortion has increased in countries that have many legal restrictions in place. For 2015-2019, almost half of unintended pregnancies (46%) were aborted in countries where abortion was restricted (often severely) and a little over two-thirds (70%) in countries where abortion is accessible.
In the three regions where around 40-50% of with unintended pregnancies have restricted access to abortions, overall abortion rates per 1,000 women of reproductive age differ by less than 2 abortions per 1,000 from those in countries (or US states) without restrictions. These are the USA (11 versus 13 per 1,000), the Returned West (11 versus 10 per 1,000) and Latin America (30 versus 31 per 1,000). The Returned West consists of former Soviet-bloc countries that have joined the EU, and the largest of these, Poland, is the only one to have restricted abortion, prohibiting it for fetal impairment, economic or social reasons, or on request.
The figures presented above suggest that the illegalization of abortion will not substantially reduce its incidence. Over recent decades, most of the changes to the legal grounds for abortion have been in the direction of recognizing women’s rights to reproductive autonomy (recent examples include Ireland, Argentina, Mexico and Columbia). Removal of a right that women have had for 50 years in the USA is an entirely different situation.
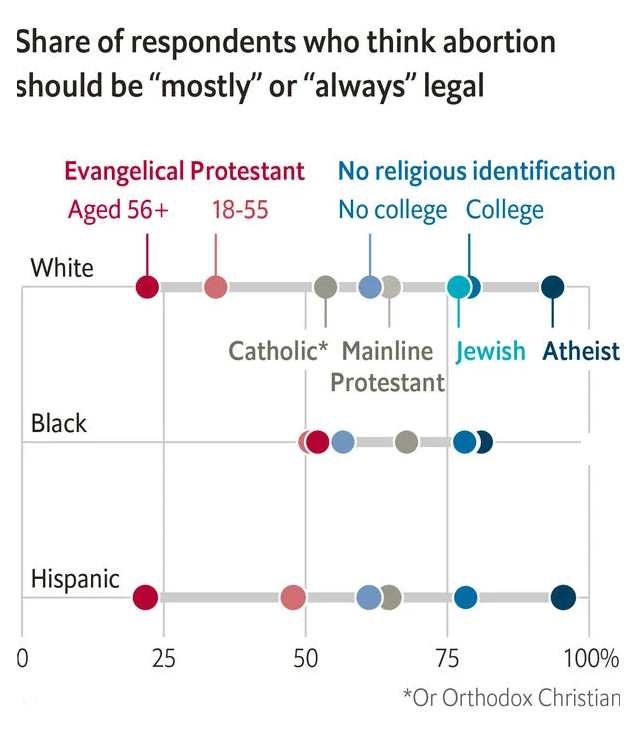
The increasing restrictions in the USA are one of the few examples of major reductions in women’s rights occurring outside the Islamic countries where religious extremists have taken control of government. In the case of the USA, these changes are to rights that women have had for half a century and are being driven by an anti-democratic coalition of white nationalists and religious extremists who do not represent the majority views of the population. A recent issue of the Economist identified white evangelicals as the one major group with majority opposition to the legal availability of abortion. A majority of Catholics, mainline Protestants and those with no religious identification think that abortion should be mostly or always legal in the USA, and support is over 75% for Jewish, atheists and non-religious with college education.
Reproduced from: Religion, not gender, is the best predictor of views on abortion.The Economist, May 7th 2022.
The rhetoric of some US extremists, and actions already taken to restrict health insurance coverage for contraceptive use, suggests that further restriction on abortion access may well also be accompanied by further reductions in contraceptive availability. The unintended pregnancy rate may well increase, resulting in an overall increase in numbers of abortions occurring, even if the restrictions reduce the percentage of unintended pregnancies that end in abortion.
In my next post, I will examine differences in maternal mortality across countries and the extent to which they are associated with legal restrictions on abortion.
Sixteen years ago, I published a paper in PLoS Medicine with detailed projections of deaths by age, sex and cause for all regions of the world, from year 2002 to 2030. That paper has proved very popular, with over 14,100 citations to date. Following the release in 2018 of the latest WHO update of causes of death for years 2000-2016, I carried out another update of projected global causes of death, extending the projections for the first time beyond 2030 to 2060.
These projections were also released on the WHO website in 2018 along with documentation describing the methods used. In the original projections, separate projection models were developed for HIV/AIDS, tuberculosis, lung cancer, diabetes mellitus and chronic respiratory diseases. As well as revisions to these models, additional special projection models were developed for malaria, maternal deaths, road injury, homicide, natural disasters and war and conflict.
I recently wanted to check up on some of the methods used, and discovered that the projections are no longer available on the WHO website. During my two decades with WHO, I always tried to ensure that older versions of WHO statistics and the methods used to produce them were archived on the WHO website in such a way that they continued to be available. This is important as WHO statistics get quoted and cited by many other publications and websites, and it is immensely frustrating when they cease to be available for anyone wanting to follow up citations of them. Particularly for global health statistics which are regularly or irregularly updated, it is important for transparency and replicability that revised data and methods can be compared with earlier versions. For this reason, the 2016-2060 projections and methods paper have been made available for download here. While the projections are outdated now, and also don’t take into account the impact of the Covid-19 pandemic, the novel methods developed for specific causes may also be of interest, particularly for road injury, natural disasters and conflicts.
Global mortality 2016-2060 — Business-as-usual scenario
See here for a previous post giving an overview of the projection results. These projections are “business-as-usual” projections under specified assumptions that do not specifically take account of trends in major risk factors apart from tobacco smoking, and to a limited extent, overweight and obesity. The downloadable spreadsheets includes point estimates for projected deaths by region, cause, age and sex under a business-as-usual scenario for projected covariates. Explicit uncertainty ranges were not included here, uncertainty in projections is better conveyed through comparison of optimistic and pessimistic scenarios with varying input assumptions (these were carried out but not released).
The number of significant figures displayed in worksheet cells in the Excel workbooks do not provide information on uncertainty ranges of projected estimates. The base scenario does not necessarily represent the best predictions or potential range of future global and regional health trends; it is possible that more sophisticated causal models incorporating projections of important determinants may provide better predictions for specific diseases.
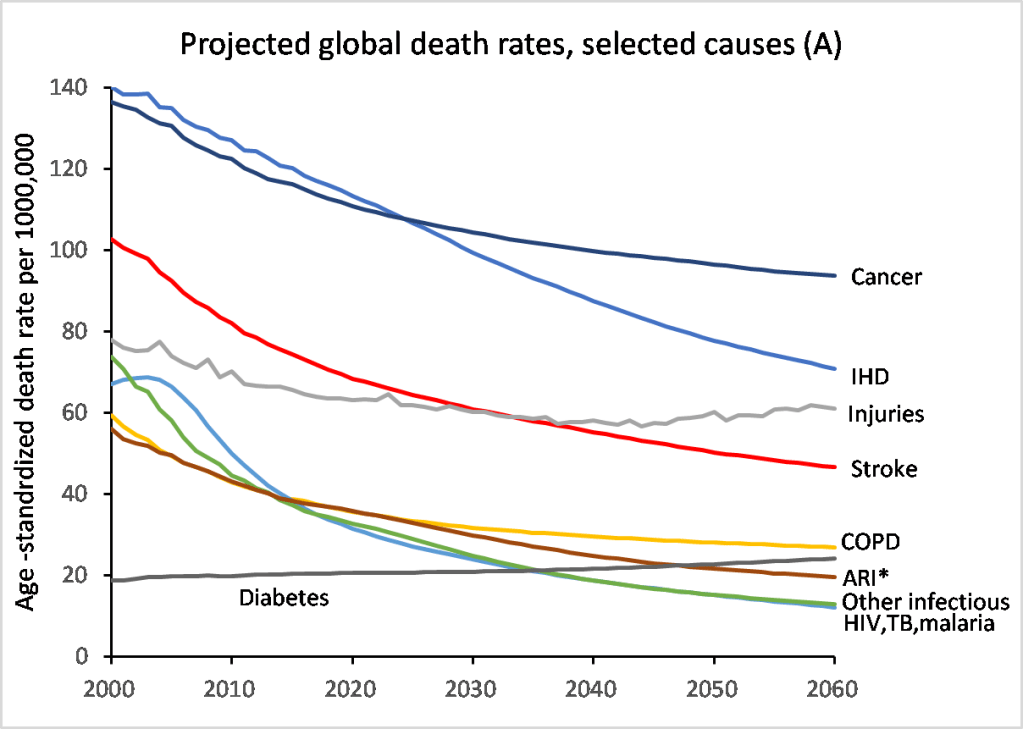
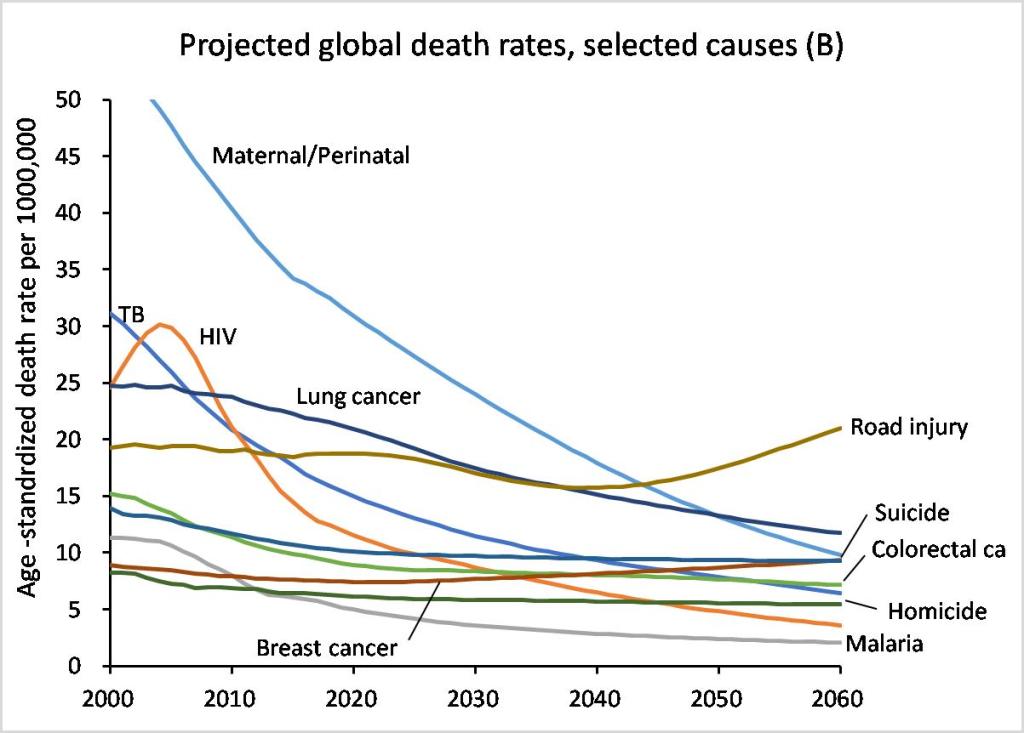
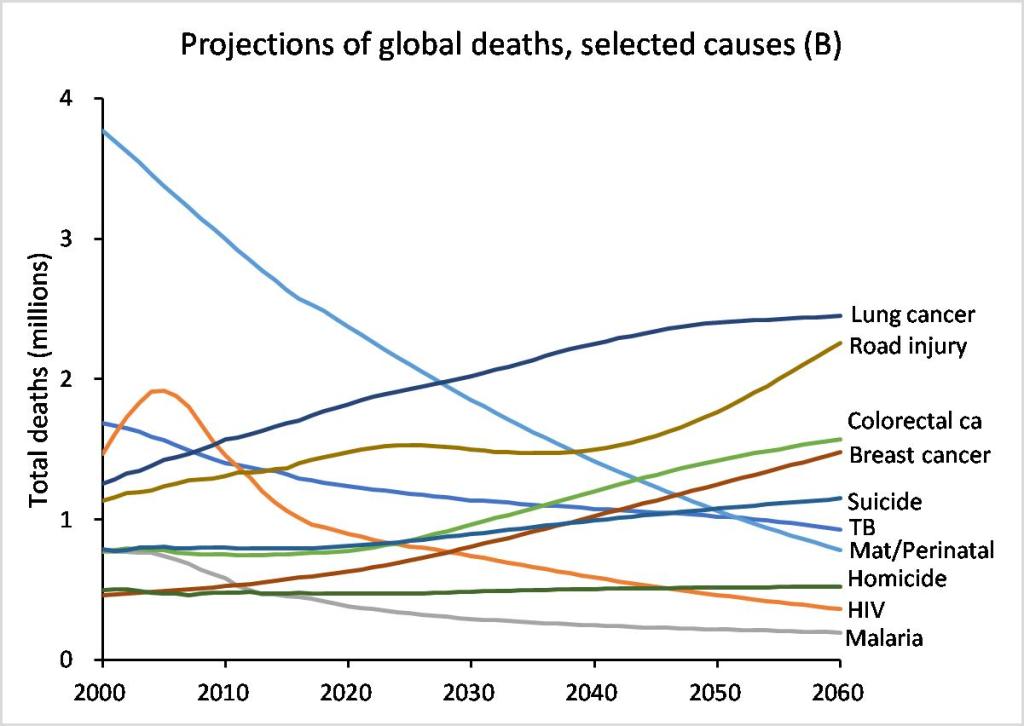
Apart from synchronising the new projections with the 2016 cause of death estimates, the cause-specific trends in the near term are synchronized with estimated recent trends over the last 10 to 15 years. In the longer term, broad trends are largely driven by projection equations which model the epidemiological transition from infectious to non-communicable diseases in terms of projections of average income per capita, average years of education, time, and for some causes also projections of smoking impact. At the global level, age-standardized death rates for most important causes are falling with time, faster in most cases for infectious, maternal and perinatal causes than for non-communicable diseases (see figures below). The main exceptions are for diabetes, breast cancer and road injuries. The specific projection model for diabetes is based on projections of the prevalence of overweight and obesity and that for road injury is based on projections of vehicles per capita with continued economic development.
However, for many of these causes, the total projected deaths are rising with time because of population growth and ageing. Only the relatively fast declining infectious, maternal and perinatal causes are likely to also have declining total numbers of deaths (see the following two figures).
The projections of deaths by cause are not intended as forecasts of what will happen in the future but as projections of current and past trends, based on certain explicit assumptions. The methods based the disease burden projections largely on broad mortality projections driven by projections of future growth in income and increases in human capital in different regions of the world, together with a model relating these to cause-specific mortality trends based on the historical observations in countries with death registration data over the last 60 years. The results depend strongly on the assumption that future mortality trends in poor countries will have a similar relationship to economic and social development as has occurred in the higher income countries. If economic growth in low income countries is lower than the forecasts used here, and global warming results in additional adverse impacts on economic and social development, then the world may achieve slower progress and widening of health inequalities.
Projected global deaths in 2030 and 2060 under the business-as-usual scenario are 68.2 million and 101.8 million respectively. Projected global deaths in 2030 under the UN medium variant projections of the World Population Prospects 2017 (WPP2017) are 2% higher in 2030 at 69.5 million and 0.7% lower at 101.1 million in 2060. These global projections for all-cause mortality are remarkably close to the UN projections given that these are the sum of independent projections for 20 separate cause groups, whereas the UN projections are based on estimated trends in all-cause mortality and fertility. The results are also very similar for all regions except the South East Asian Region and the African Region. For the South East Asian Region, the UN projections are higher, with 3.5% more deaths in 2030 rising to 12% more deaths in 2060. For the African Region, the UN projections are slightly higher in 2030 but by 2060 are 12% lower.