In the last two weeks, Australia has gone from having one of the lowest rates of new Covid cases per million population in the world to one of the highest. Most of these new cases are in NSW and according to the Guardian today, if NSW were a country it would be in the top 10 for new cases notified per million population.
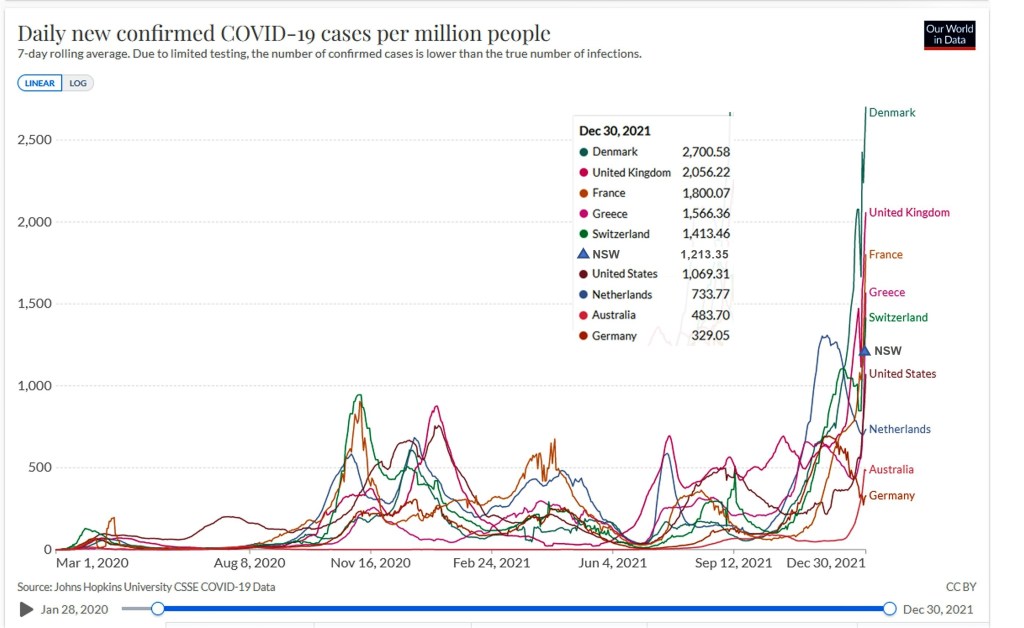
The plot below shows my selection of European countries plus USA and Australia. Australia for the first time is now in with the crowd, currently sitting between the rate for Germany and the Netherlands. I’ve also added the 7-day rolling average for NSW to 30 December, which puts it between Switzerland and the USA. Based on the daily new cases reported for NSW today (31 December, https://covidlive.com.au/nsw), the NSW rate has jumped to 2,580 per million today. Figures for today are not yet available for Northern hemisphere countries, but I suspect NSW rate has jumped above all the countries in the plot except Denmark and possibly the UK.
The good news is that hospitalizations and deaths remain low compared to previous waves, and the booster dramatically lowers Covid risk.
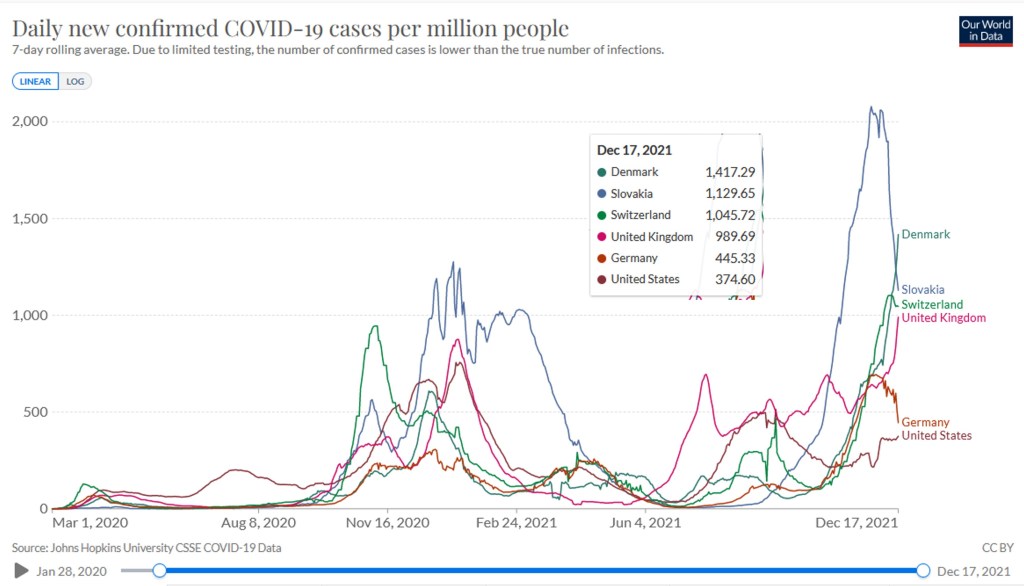
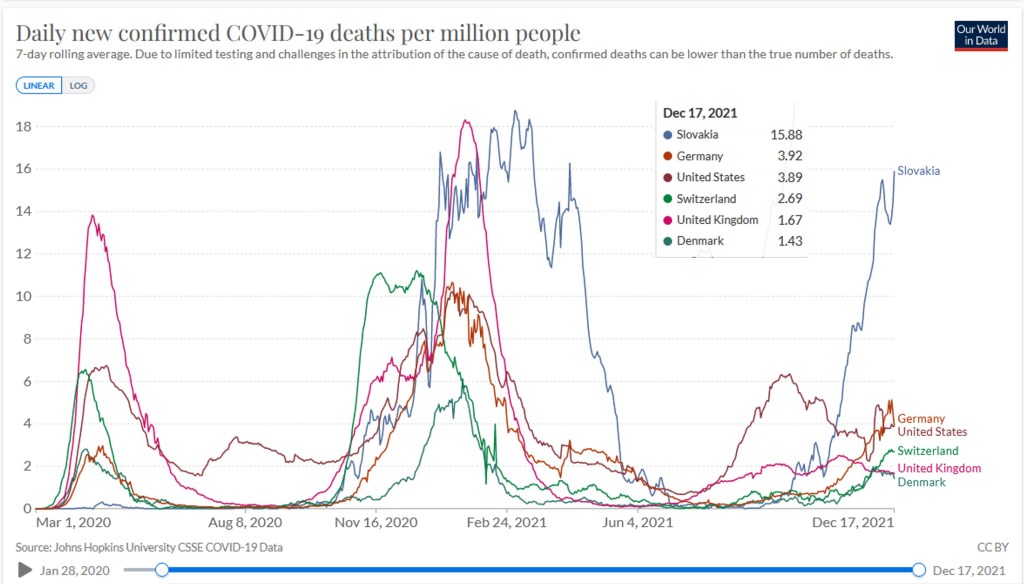
Switzerland now has the third highest daily new confirmed cases per million (averaged over last 7 days) at 1,045 per million. This is exceeded only by Denmark (1,417) and Slovakia (1,130). The UK is not far behind Switzerland at 990. At least the daily new death rate per million (7 day average) is quite low for Denmark (1.43) and Switzerland (2.69) compared to many countries (eg. USA and Germany both 3.9 per million). The comparability of these figures is influenced by differences in testing rates and differences in data collection, definitions etc.
Apparent case fatality rates are low for Switzerland, UK and Denmark at 0.25% or lower. Germany and Slovakia have higher rates at around 0.7% and the USA even higher at 1.1%. Based on the limited genetic analyses available, omicron still accounts for only a few per cent of cases, ranging from 1% in USA to 4% in Slovakia, and all the rest is essentially delta now.
The Swiss government is tightening restrictions from 20 December onwards. For settings where it is not possible to wear a mask or be seated, you must be fully vaccinated or recovered within last 4 months, or provide a negative test. Working from home will be mandatory.
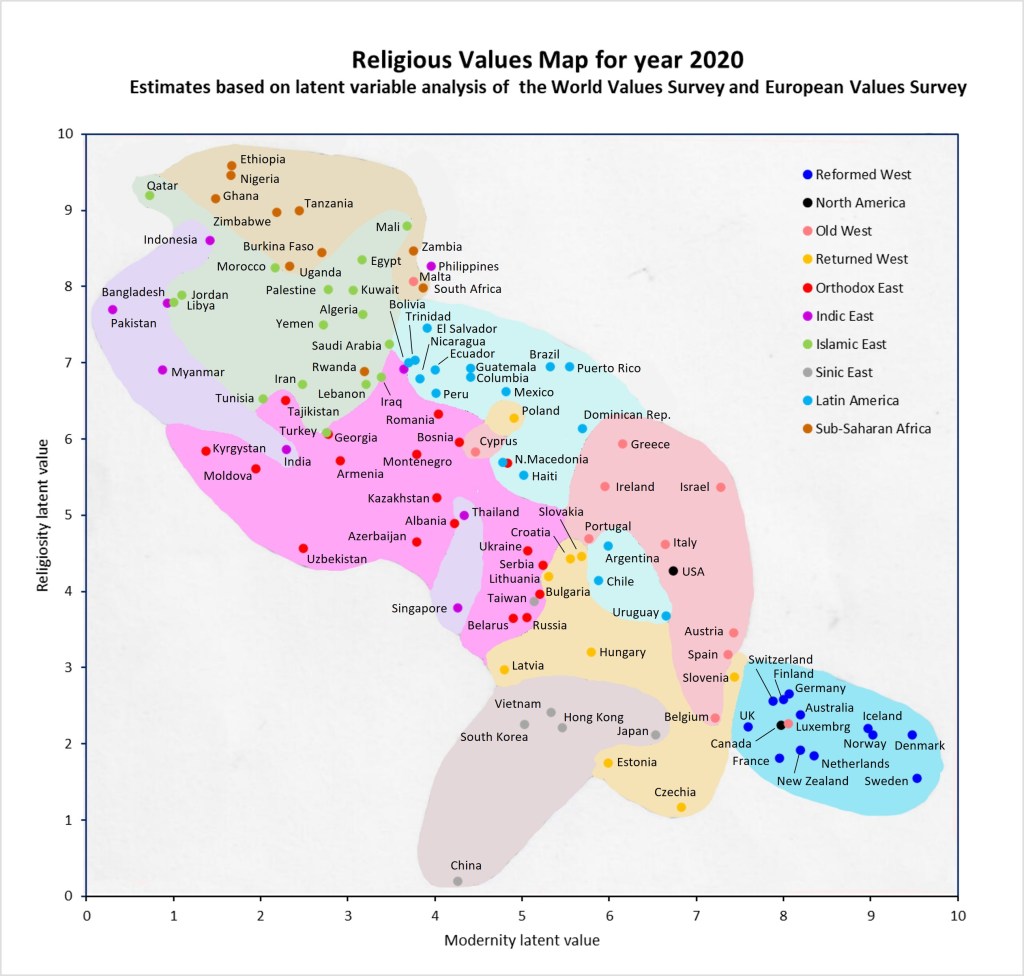
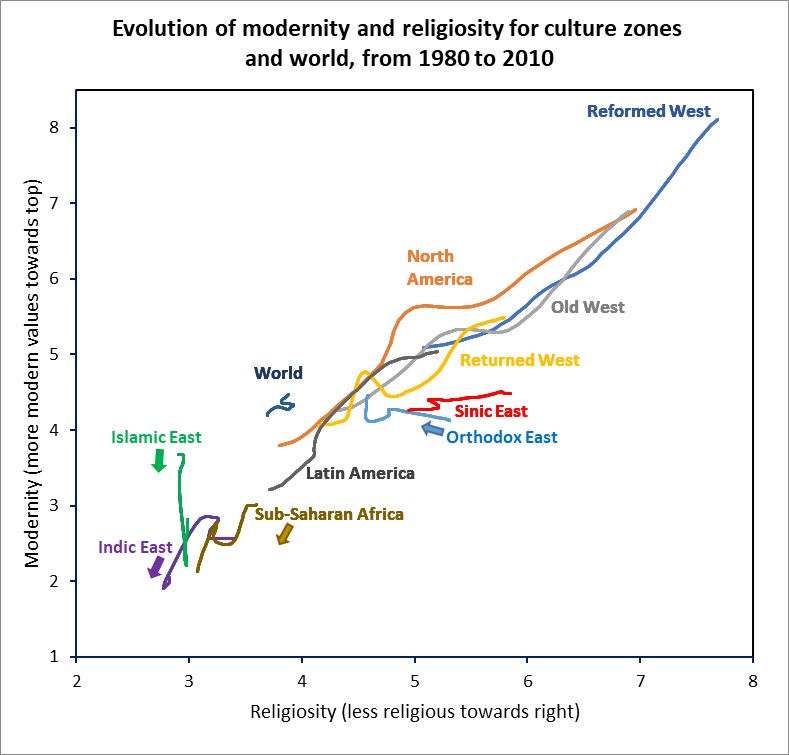
In my previous post, I presented results for an updated version of the latent variable analyses I carried out last year on data from the World Values Survey and European Values Study [1-4]. I have re-estimated a latent variable for religiosity on a continuous scale running from very religious (low values) to non-religious and atheist (high values) and also a latent variable for values running from strongly pre-modern values (low) to modern values (high). I estimated these values for 110 countries for years from 1980 to 2020. The map below plots these countries according to their latent variable values for modernity (horizontal axis) and religiosity (vertical axis). The colours indicate culture zone and the shading roughly indicates the main domain of countries in each culture zone. Moving downwards to the right on this graph indicates increasing modern values and decreasing religiosity. The inspiration for this map presentation was the culture zone maps produced for earlier waves of these surveys by the political scientists Ronald Inglehart and Christian Welzel [5].
The North America culture zone includes only two countries, the USA and Canada. It is clear from the map that Canada belongs with the Reformed West countries in contrast to the USA, which sits in the Old West zone close to Italy, and also not far from three South American countries: Argentina, Chile and Uruguay. Malta and Cyprus are also outliers for the Old West culture zone, with higher levels of religiosity and less modern values. Along the decreasing religiosity-increasing modernity axis, Qatar is at the top end and Sweden at the bottom end. China is an outlier to the lower left, with the lowest level of religiosity of all the countries, but also a modernity value towards the middle of the scale between modern and pre-modern.
References
Inglehart, R., C. Haerpfer, A. Moreno, C. Welzel, K. Kizilova, J. Diez-Medrano, M. Lagos, P. Norris, E. Ponarin & B. Puranen et al. (eds.). 2014. World Values Survey: All Rounds – Country-Pooled Datafile Version: https://www.worldvaluessurvey.org/WVSDocumentationWVL.jsp. Madrid: JD Systems Institute.
Haerpfer, C., Inglehart, R., Moreno,A., Welzel,C., Kizilova,K., Diez-MedranoJ., M. Lagos, P. Norris, E. Ponarin & B. Puranen et al. (eds.). 2020. World Values Survey: Round Seven–Country-Pooled Datafile. Madrid, Spain & Vienna, Austria: JD Systems Institute& WVSA Secretariat[Version: http://www.worldvaluessurvey.org/WVSDocumentationWV7.jsp].
Gedeshi, Ilir, Zulehner, Paul M., Rotman, David, Titarenko, Larissa, Billiet, Jaak, Dobbelaere, Karel, Kerkhofs, Jan. (2020). European Values Study Longitudinal Data File 1981-2008 (EVS 1981-2008). GESIS Datenarchiv, Köln. ZA4804 Datenfile Version 3.1.0, https://doi.org/10.4232/1.13486.
EVS (2020): European Values Study 2017: Integrated Dataset (EVS 2017). GESIS Data Archive, Cologne. ZA7500 Data file Version 3.0.0,doi:10.4232/1.13511
In a previous post, I developed a continuous latent variable for pre-modern/modern religious values based on data for waves 5 to 7 country surveys in the World Values Survey (WVS) and European Values Study (EVS). I used this data to estimate average values of the latent variable for 104 countries for the period 2017-2020. I have recently re-analysed the combined updated IVS dataset released earlier this year [1-4]. In a recent post, I presented revised estimates for trends in the prevalence of atheism and religiosity. The main revision to the dataset was to correct an error in the data for the USA which had led to overestimates of atheism prevalence in my original analysis.
My earlier post discusses in some detail the conceptualization and operationalization of modern and pre-modern religious values. I will give a very brief overview of this in terms of Kohlberg’s three stages of moral development. Stage 1 moral values and related religious values focus on absolute rules, obedience and punishment and an individual is good in order to avoid being punished. In stage 2, the individual internalizes the moral standards of the culture and is good in order to be seen as a good person by oneself and others. Moral reasoning is based on the culture’s standards, individual rights and justice. In stage 3, the individual becomes aware that while rules and laws may exist for the greater good, they may not be applicable in specific circumstances. Issues are not black and white, and the individual develops their own set of moral standards based in universal rights and responsibilities. As moral values evolve through the three broad stages, the size of the in-group (“us”) with which an individual identifies typically expands from tribe to ethnic group or nation to all humanity.
Because pre-modern religious teaching is expressed and interpreted in mythic terms, it may appear to conflict with scientific understanding of the natural world. A person with pre-modern values may thus reject scientific findings, whereas another with modern values will understand that the myths communicate aspects of the human condition, but are not to be interpreted literally, and that the domain of religion relates to meaning, values, ethics, and does not generally conflict with the domain of science.
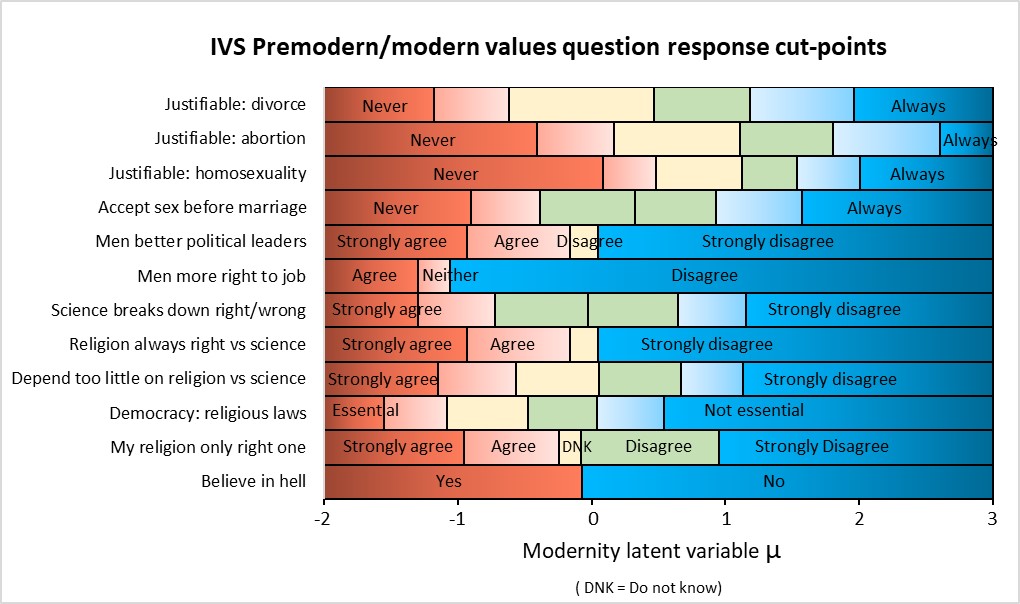
In revising my analysis of pre-modern versus modern religious values, I have slightly revised the set of IVS questions used to construct the latent variable. I dropped the question concerning belief in heaven and added a question concerning sexual freedom (approving of sex before marriage). Belief in heaven is highly correlated with belief in hell but has a somewhat higher population prevalence and is less discriminatory between modern and pre-modern values. In constructing the previous version of the modernity latent variable, I argued that sexual freedom issues were associated with the pre-modern values of the era when high fertility was important to ensure some children survived to reproductive age, and societies thus discouraged divorce, abortion, homosexuality. I excluded sexual freedom questions from the analysis on the grounds that the demographic transition to low child mortality, low fertility and widespread availability of reliable contraception is very recent and values are still changing in this domain. However, this is actually an argument to include at least one sexual freedom variable as a sensitive indicator of modern versus pre-modern values.
I have revised the estimation of the modernity latent variable (referred to hereafter as “modernity”) based on the categorical responses to the 12 questions shown in the following plot. This plot shows the item response cut-points for these questions on the estimated latent variable scale. The analysis was implemented as an ordered probit model using the stata procedure gsem for generalized structural equation models. The model was fit to the entire IVS dataset, not just the most recent survey waves 5 to 7 as previously.
For ease of presentation in the following plots, I applied a linear transformation of the estimated modernity values latent variable by multiplying it by 6 and adding 4.5. This resulted in the average value of the latent variable at country level ranging from 0.28 for Pakistan to 9.54 for Sweden in the year 2020. At individual level, 90% of values of the values latent variable for all respondents in all surveys fall in the range –0.21 to 9.60 with a median value of 4.52.
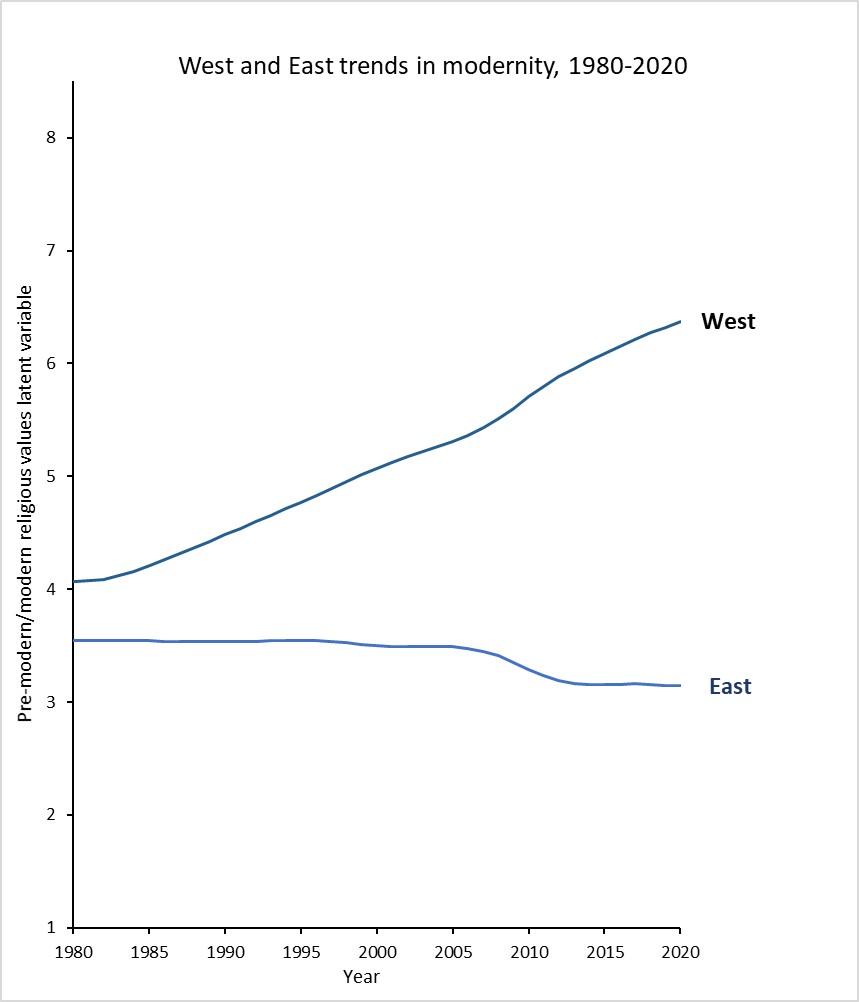
There is a general trend of increasing modernity in the culture zones associated with Western Europe, the Americas, Australia, New Zealand and former Soviet regions, excluding the Orthodox East. I have grouped these together as a single larger zone labelled “West” and the other regions are grouped as “East”. The following plot shows the trend in modernity (population average) for West and East from 1980 to 2020. There is a sustained increase in modernity in the West at a closeto linear rate of increase over time. Despite the flat trend in the Sinic East and Orthodox East, the overall trend in the East is decreasing modernity with a somewhat faster decline during the years 2005-2010. These two trends largely cancel each other out, so that at the global level there has been little change in the average level of modern versus pre-modern values over the forty year period.
In every culture zone, practicing religious people have the lowest score for modern religious values, ie the most pre-modern values) and modern religious values increase with decreasing levels of religiosity. The variation across culture zones is approximately as substantial as the variation across religiosity categories. To examine the combined evolution over time of religiosity and modern religious values, I also recomputed the religiosity latent variable that I previously estimated (see here). I also applied a linear transformation of the estimated religiosity latent variable by multiplying it by -1.22 and adding 5. This also reversed the direction of religiosity so higher values are associated with lower levels of religious belief and behaviour. This resulted in the average value of religiosity at country level ranging from 9.6 for Ethiopia to 1.55 for Sweden and 0.20 for China in the year 2020. At individual level, 90% of values of religiosity for all respondents in all surveys fall in the range –2.2 to 11.2 with a median value of 4.9.,
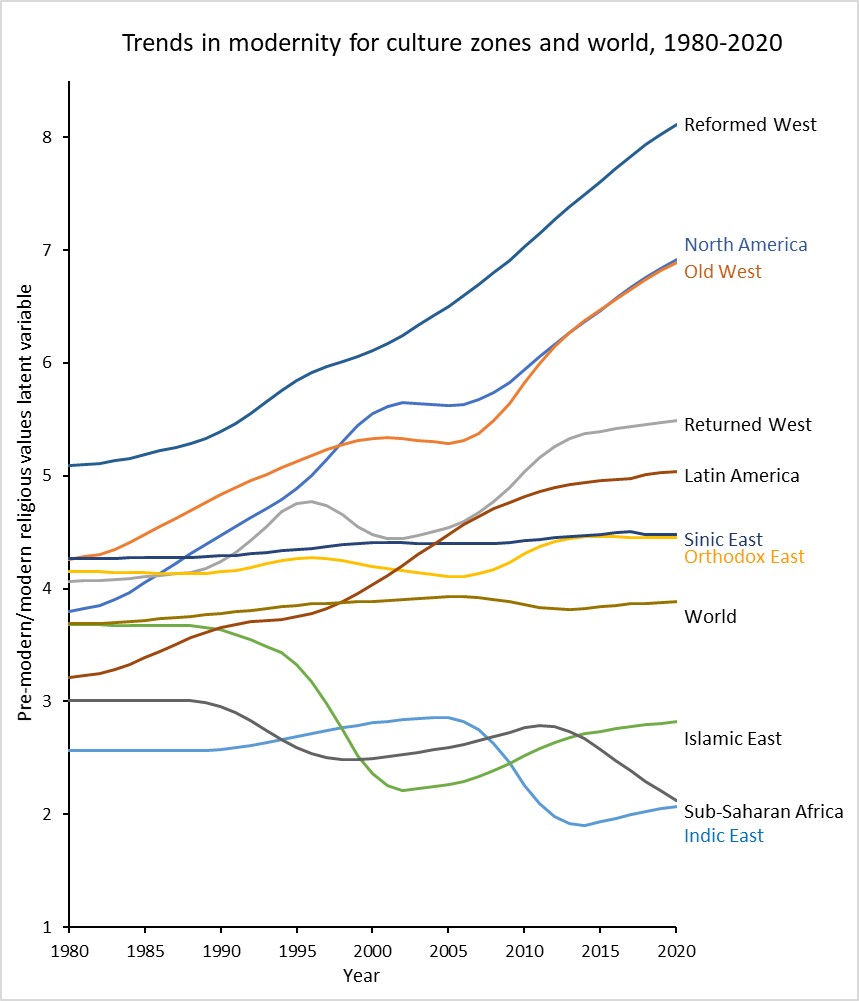
The following plot shows the co-evolution over time for religiosity and modernity by culture zone from 1980 to 2020. For most regions, religiosity and modernity have evolved towards the upper right. Those regions where it has evolved in a different direction have arrows indicating the direction of time. For the Reformed West, Old West, Returned West, North America and Latin America, modernity has increased over time with religiosity (ie. with reducing religious belief and practice) at almost the same rate across all these regions. The Orthodox East in contrast has experienced a change in religiosity towards increasing belief (non-practicing) at the same time as modernity has slightly increased. This reflects the fact that in this culture zone in the post-Soviet period, “orthodoxy” has become an expression of national identity rather than increased religious belief/practice. The Sinic East has experienced some reduction in religious belief/practice, with little change in modernity.
In contrast, the Islamic East, Indic East and Sub-Saharan Africa have all evolved in the opposite direction towards higher prevalence of pre-modern religious values and greater religious belief/practice. As a result, there has been negligible evolution of religiosity and modernity at the global average level.
Note on uncertainty
These plots, and the country or culture zone comparisons show broad patterns but specific small differences should not be over-interpreted. I have not attempted to estimate uncertainty ranges for these statistics because for surveys implemented in many countries by different study teams the most important contributors to uncertainty of statistics are generally not the survey sample size or sampling issues but other less quantifiable differences in survey implementation, design and translation. Also important and difficult to quantify are differences in translation, interpretation and choice of question response categories in different populations. Most of the IVS surveys are representative samples of adults with sample size ranging between 1 and 2 thousand. This is quite similar to the typical national opinion poll where uncertainty of statistics is typically around 2 or 3 percentage points.
There are a substantial number of countries where the WVS and EVS both conducted a survey in the same wave. I’ve assessed the median difference between the two surveys for a country to provide some quantification of the typical variation induced by sampling methodology, survey design and implementation. It will not include cross-national differential response associated with language, translation and response category cut-point shifts.
For the religiosity categories at country-level, average prevalences differ by around a median 10% (relative difference). This drops to around 5% at culture zone level. There is an additional layer of uncertainty added in the estimation of latent variables due to the uneven prevalence of missing questions and values across survey waves, with generally large proportions of missing values in earlier survey waves. So smaller differences and trends in results shown here should not be over-interpreted.
References
Inglehart, R., C. Haerpfer, A. Moreno, C. Welzel, K. Kizilova, J. Diez-Medrano, M. Lagos, P. Norris, E. Ponarin & B. Puranen et al. (eds.). 2014. World Values Survey: All Rounds – Country-Pooled Datafile Version: https://www.worldvaluessurvey.org/WVSDocumentationWVL.jsp. Madrid: JD Systems Institute.
Haerpfer, C., Inglehart, R., Moreno,A., Welzel,C., Kizilova,K., Diez-MedranoJ., M. Lagos, P. Norris, E. Ponarin & B. Puranen et al. (eds.). 2020. World Values Survey: Round Seven–Country-Pooled Datafile. Madrid, Spain & Vienna, Austria: JD Systems Institute& WVSA Secretariat[Version: http://www.worldvaluessurvey.org/WVSDocumentationWV7.jsp].
Gedeshi, Ilir, Zulehner, Paul M., Rotman, David, Titarenko, Larissa, Billiet, Jaak, Dobbelaere, Karel, Kerkhofs, Jan. (2020). European Values Study Longitudinal Data File 1981-2008 (EVS 1981-2008). GESIS Datenarchiv, Köln. ZA4804 Datenfile Version 3.1.0, https://doi.org/10.4232/1.13486.
EVS (2020): European Values Study 2017: Integrated Dataset (EVS 2017). GESIS Data Archive, Cologne. ZA7500 Data file Version 3.0.0,doi:10.4232/1.13511
Switzerland is now offering a Covid-19 booster shot to to the 65+ and at-risk who has had their two Covid-19 vaccinations at least six months ago. It may soon be extended to all adults. I had my third shot last Thursday with no side effects (not even a localized sore spot) and was surprised to receive a Pfizer booster after being fully vaccinated earlier this year with the Moderna vaccine. The mRNA in both vaccines encode the same S-2P protein which differs from the covid19 spike protein by two amino acids only. These stabilize the spike protein so that it can train the immune system before it enters the host cell (see here for details).
However, they differ in the “packaging” regions around the actual genetic code for the protein. These leader and trailer regions are responsible for initiating and regulating the translation of the mRNA to produce the protein which stimulates an immune response. The other major difference between the two vaccines is that there is a much larger dose of vaccine (100 mg) in a Moderna dose compared to a Pfizer dose (30 mg). While the initial protectiveness of both vaccines is similar at around 94-95%, there is some evidence that the protectiveness may decline at a somewhat slower rate for Moderna than Pfizer.
There is also evidence that getting a different booster shot that the vaccine you originally received actually enhances the immune response more than getting the same type of vaccine for a third dose (see here and here). There is a small advantage mixing the two mRNA vaccines (Pfizer and Moderna) as I have done, and a substantially enhanced immunogenicity when non-RNA vaccines (eg. Astrozenica or Johnson and Johnson).
So how effective is the booster shot? A large study published in the New England Journal of Medicine in October compared outcomes in 1.14 million Israeli adults aged 60 years and over who had received two Pfizer doses at least 5 months earlier, of whom around half received a Pfizer booster shot and the other half did not. The analysis controlled for possible confounding factors including age, sex, demographic group and the date of the second vaccine (to ensure there were not differences in the time since second vaccine between the control and booster group).
The results were dramatic. At least 12 days after the booster dose, the rate of confirmed infection was lower in the booster group than in the nonbooster group by a factor of 11.3; the rate of severe illness was lower by a factor of 19.5. These findings clearly show the effectiveness of a booster dose even against the currently dominant delta virus. Recent reports have suggested that the efficacy of a vaccine administered 6 months earlier against the currently dominant delta virus is reduced by approximately 50% compared to the post-vaccination efficiency of 95% against the alpha variant (see here, here and here). So the susceptibility to the delta variant of a person who has received the third dose would be reduced from around 50% to 5%, and even less if they receive a different vaccine than their first two shots.
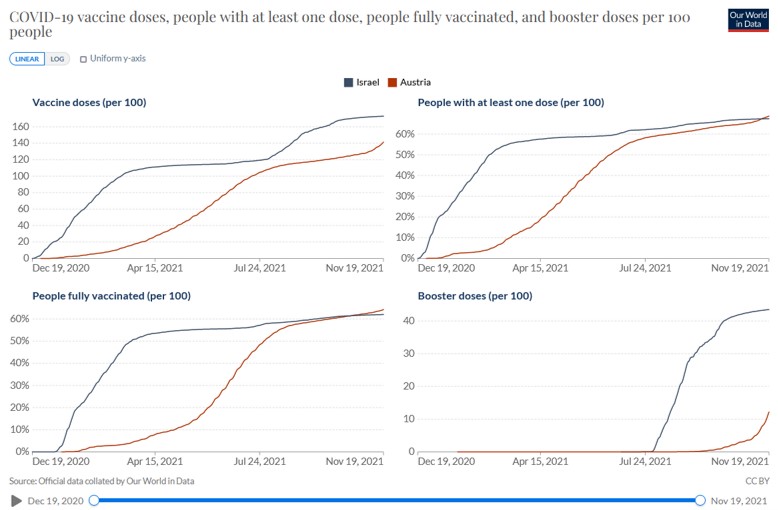
On July 30, 2021, Israel was the first country in the world to make available a third dose of the BNT162b2 vaccine against Covid-19 to all persons who were 60 years of age or older and who had been vaccinated at least 5 months earlier. Since then, Israel has extended the booster program to the entire population. The following graph shows trends in vaccination rates and booster doses for Israel and Austria (as a typical example of a Western European country). The fully vaccinated rate (two doses) is essentially identical for the two countries from August onwards at a little over 60%. Booster doses per 100 people rose from zero at the end of July to over 40 per 100 currently.
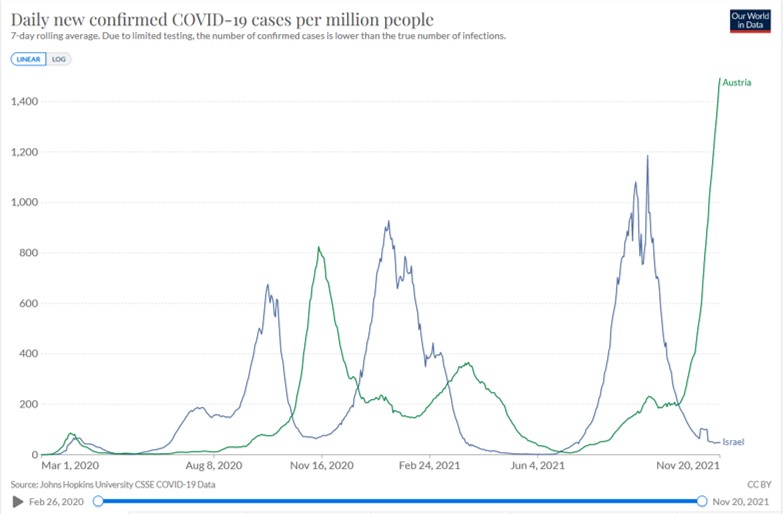
The next graph shows the daily new cases per million for Israel and Austria (which is currently experiencing one of the largest increases in Delta cases in western Europe). Israel had a huge spike in infections this summer due to the highly infectious Delta strain, together with a combination of waning immunity five or six months after the second jab. Its clear that the booster shots were definitely a game changer. Over time, there was a very steep reduction in infections, hospitalizations and deaths among the people that got the booster shot. Israel went from over 11,000 new cases a day at the peak, down to a few dozen today. Before the booster campaign started hospitalizations were rising among vaccinated people whose immunity had waned, but the overwhelming majority of hospitalizations now are of people who are unvaccinated.
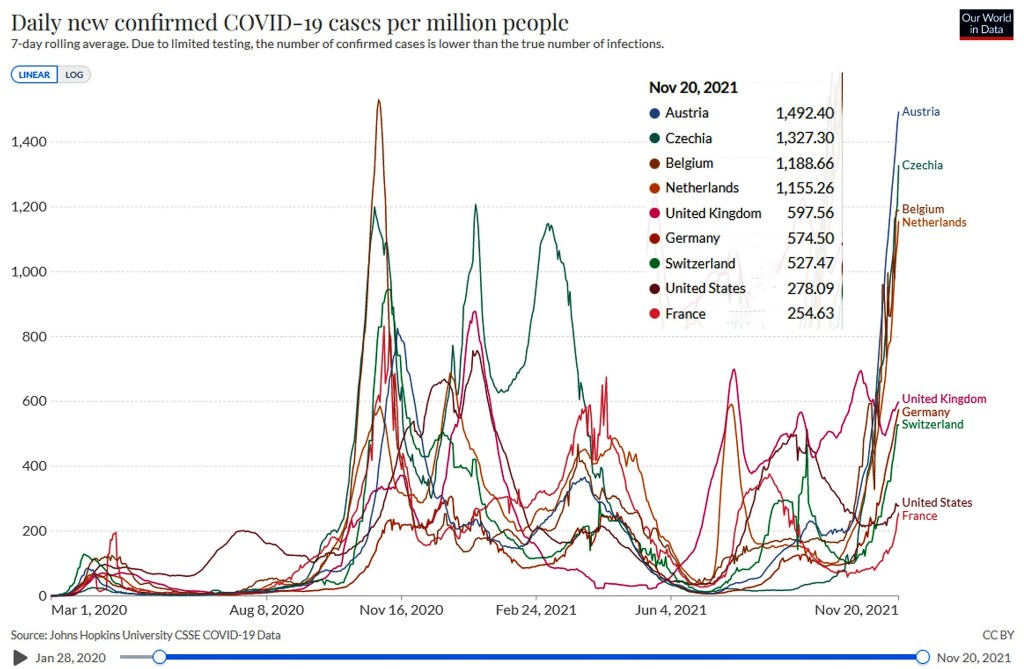
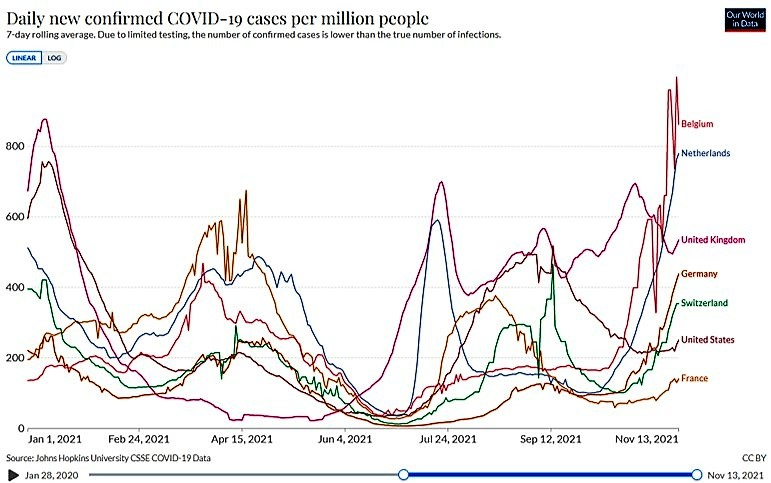
The same combination of waning immunity and Delta are now causing rising cases in Europe, as illiustrated in the following plot. Austria, Belgium and the Netherlands are currently the hardest hit (see graph below), with average daily new cases well over 1,000 per million, higher than any previous wave. In most of the countries on this graph, fully vaccinated rates are somewhere between 60 and 75%. That means around 25 to 40 percent of these populations are unvaccinated and their much higher susceptibility to infection is driving the latest surge in Delta infections.
Germany, Austria and the German-speaking region of Switzerland have the largest shares of unvaccinated populations in all of Western Europe. About one in four people over 12 is unvaccinated, compared with about one in 10 in France and Italy, and almost none in Portugal.
Governments are struggling to address this shortfall in vaccination levels. Austria has introduced a lockdown for anyone over the age of 12 who is not vaccinated and foreshadowed compulsory vaccination for all adults. Germany is considering new restrictions and in Saxony the unvaccinated are already barred from non-essential shops and other locations. The Netherlands has flagged that they will move to full lockdown for the unvaccinated but not the vaccinated. Switzerland has a referendum next weekend on whether to continue with the vaccine mandate which allows only fully vaccinated people to go to theatres, restaurants, gyms and other indoor public venues.
Covid-19 cases rose by 7% and deaths by 10% over the last week in Europe, as it enters a fourth (or fifth) wave and currently accounts for about two-thirds of infections reported globally. Belgium and the Netherlands, which have fully vaccinated 73-74% of their populations, have the highest new case rates in Western Europe, almost double those of Britain. The fully vaccinated rate is Switzerland is 64%, higher than the USA at 57% but lower than Australia now at 69%.
I drove past the UN Palais de Nations yesterday, which had a crowd of around 2000 anti-vaccination protesters outside it, apparently concerned about loss of “freedom”. The Netherlands has just reimposed a partial lockdown to address the rapidly rising case numbers and Switzerland won’t be far behind if the protestors have their way. I am way more concerned about the potential loss of freedom of association, ability to work and earn money, for students to attend schools and universities, ability to participate in social, sporting and cultural events etc etc than the freedom of a minority to be evidence-averse idiots who incubate the virus to continue to spread it and make life difficult for the vaccinated (who still have a small but non-zero risk of catching Covid from the unvaccinated in which it is spreading like wildfire).
Swiss anti-vax protestors in Fribourg and Geneva
Later this month, Switzerland will be holding its second referendum in less than six months on the Covid-19 law under which the government has made the Covid-19 certificate compulsory since September 13 to access indoor spaces (movie theatres, gyms, restaurants etc). This law was accepted by 60.2% of voters on June 13, and opinion polls indicate it will be accepted again. The Covid certificate has allowed the (intelligent) population to return to an almost normal social life. I’ve gone to the cinema, been training at the gym mask-free, and met up with friends for coffee, lunch or dinner. All at risk if the anti-vax people get more support than before. The proposed revisions to the law also put other covid initiatives at risk. If passed, they would end government financial support for big events and end all government funding programs for the development of drugs or other important medical goods.
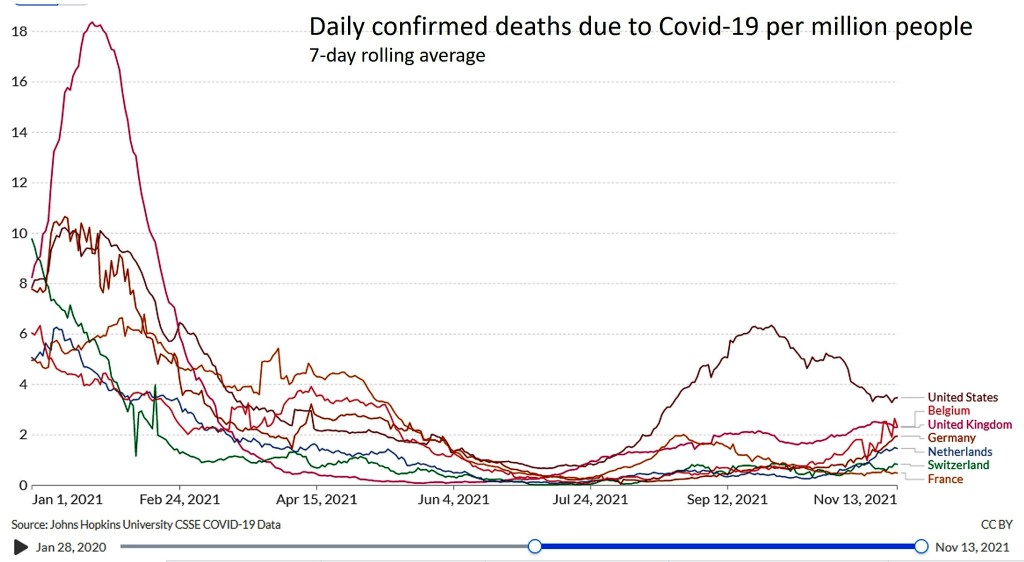
While death rates are substantially lower than in previous waves, death rates are starting to rise reflecting rising case rates. And apart from death, there is significant disability with “long-Covid” which affects a significant proportion of people who are infected.
In previous posts, I have summarized various analyses of the World Values Survey (WVS) and the European Values Study (EVS), altogether including more than 110 countries, and focusing on trends and differences religious affiliation, religious beliefs and practices, as well as traditional and modern values. I examined the prevalence of religious people, non-religious people and atheists across 110 countries in 2020 here, and trends from 1980 to 2020 here.
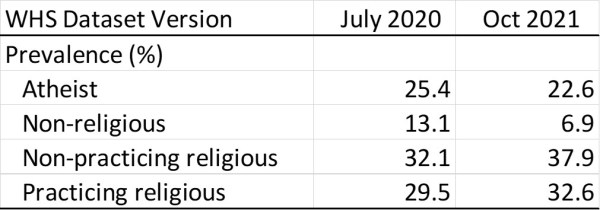
Checking in on the World Values website earlier this year, I discovered that the World Values Survey dataset has been updated to fix some errors in the coding of data for. Some data collected using a mobile phone app in the most recent US survey was incorrectly coded and this mainly affected the religiosity categories. Comparison of the US prevalences for religiosity show that the coding errors resulted in an overestimate of the atheist and non-religious categories as shown in the following table:
Comparison of religiosity prevalence estimates for USA in year 2020
This post provides updated estimates of religiosity levels and trends for countries, regions and world based on the 2021 release of the combined data for the WVS and EVS in the Integrated Values Surveys (IVS) 1981-2021 [1-3]. In carrying out these updates, I also addressed some definitional issues which have resulted in mostly slight changes to estimates for other countries.
The atheist and other categories of religiosity are constructed from the following survey questions:
Survey question
Response categories
Are you a religious person?
A religious person / Not a religious person / A confirmed atheist
Importance [in life: religion]
Very, Rather / Not very / Not at all
How often do you attend religious services?
More than once a week / Once a week / Once a month / Only on special holy days / Once a year / Less often / Never, practically never
Pray to God outside of religious services?
More than once a week / Once a week / At least once a month / Several times a year / Less often / Never
Belief in god
Yes / No / Don’t know
Importance [in life: God]
1 (Very important), 2…9, 10 (Not at all important)
Religious affiliation
None, 9 or more religion/denomination categories, Other
Estimates of atheism prevalence based on WVS/EVS, or the Pew or Gallup surveys addressing this question often quote statistics based on question categories such as “confirmed atheist” or “not religious” or “religion: none” (see Wikipedia for more information on these). The first of these provides low estimates of overall atheist prevalence, since the qualifying adjective “confirmed” will result in many atheists avoiding this category. In the full IVS dataset (645,249 respondents), 5.5% of respondents said they were “confirmed atheists” whereas 13.3% stated they did not believe in God and a further 3.2% did not know whether they believed in God (note these figures are unweighted for sampling or country population size at this stage). In contrast, the “non-religious” and “religion: none” categories will include theists who have rejected organized religion as well as atheists.
I suspect the term “confirmed atheist” is intended to exclude agnostics (who say they don’t know whether God does or does not exist. I prefer to use the modern widely accepted definition of atheism as “lacking belief in God or gods”. This will include gnostic atheists (those who say they know gods don’t exist) and agnostic atheists (those who say they don’t know whether God or gods exist and lack a belief in any). So for the belief in God question I have recoded “Don’t know” to “No”, as a person is highly unlikely to have a belief in God which they don’t know about. This resulted in an overall distribution of 79% Yes, and 21% No (comprised 16.8% No and 4.0% recoded Don’t know).
There is an additional complexity in defining religiosity for people who are affiliated with non-theist religions such as Buddhism, Jainism, or Confucianism. This mainly relates to Asian countries, as the proportion of people who are belong to non-theist religions is generally small in other regions. The religiosity categories I defined for previous analyses moved practicing and non-practicing non-theist religious people from the atheist category to the relevant religious categories, meaning that the atheism category essentially excluded atheists who practiced non-theist religions. Asian religious practice tends to be syncretic, so for example, many people in Japan practice follow both Buddhist and Shinto religious practices. Additionally, in some cultures and non-theist religious traditions, there are mythic gods and for many people, the historical Buddha is essentially considered to be a god. In the IVS dataset, 61% of Buddhist say they believe in God, and 39% say they do not believe in God.
To obtain a complete estimate of the prevalence of atheism (those who lack a belief in God or gods), I have assigned all people who do not believe in God to the atheist category. This will thus include some religious people who practice non-theist religions. The practicing religious and non-practicing religious categories who thus be understood to refer to religious practice/belief including a belief in God or gods, including some but not all followers of non-theist religious traditions.
The four religiosity categories have thus been defined as:
Practicing religious person: A religious person who believes in God and is practicing*, OR a non-religious person who believes in God, is practicing, and rates the importance of God in range 1-5.
Non-practicing religious person: A religious person who believes in God and is non-practicing OR a non-religious person who believes in God, is non-practicing, and rates the importance of God in range 1-6.
Non-religious: A non-religious person who believes in God but rates the importance of God as 7-10 at the not important end of a 10-point scale.
Atheist: A “confirmed atheist” and/or does not believe in God
* Respondents are classified as “practicing” if they attend religious services or pray to God outside of religious services at least once a month. Otherwise, they are classified as non-practicing.
For the 110 countries with IVS survey data for years 2000 or later, the prevalences of the four religiosity categories across survey waves were projected forward to 2020 (Endnote a). The following plot shows the estimated prevalence of all religiosity categories in 2020 for countries ranked in descending level of irreligion (atheist + non-religious).
There are 18 countries where more than half the population are estimated to be atheist in 2020. These include China, South Korea, Japan, Vietnam and Thailand, all Asian countries with Buddhist and non-theist religious traditions. They also include all the Scandinavian countries and European countries such as France, the Netherlands and the United Kingdom, as well as Australia and New Zealand. At the other end are six countries where the prevalence of irreligion is estimated at less than 1% of the population.
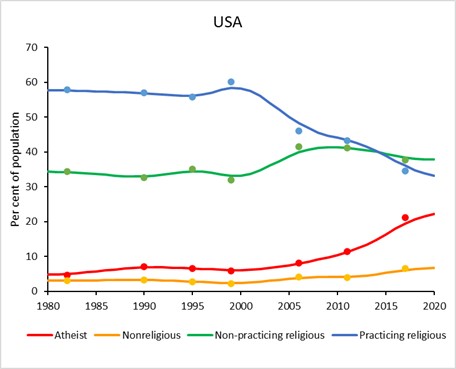
Full time series of religiosity trends from 1980 to 2020 were imputed for the 110 countries using the same methods as developed for the earlier analyses (see endnote a). The updated trends are generally similar to those previously posted (see here), except for the USA. The revised data for the USA shows that the prevalence of atheism has increased rapidly in the 21st century from around 6% to almost 23% in 2020 and the prevalence of non-religious has also increased from 2.2% to 6.9%.
The prevalence of irreligion (atheists and non-religious) has increased in the USA by an estimated 21.5 percentage points over the last two decades, the fourth largest increase of any country included in this analysis. The largest increase occurred in neighboring Canada with a 36.7% increase since year 2000. Apart from two Asian countries (South Korea and Singapore) and Hong Kong, all the other countries in the top 20 for increase in irreligion since 2000 are high income countries. And apart from Chile, Australia and New Zealand, all of these are in Europe and North America.
To compute regional and global trends in religiosity, I have also imputed religiosity for 75 countries not included in the IVS using data from Win/Gallup and Pew Research Centre surveys (Endnote b). These 75 mostly small countries (apart from in Africa) account for 8% of the world population, mostly in the Islamic East and Sub-Saharan Africa (23% and 41% respectively of the populations of those regions).
I have computed revised trends for the 11 culture zones used in previous posts. These are based on those originally defined by Welzel [4], with one modification. Because Australia’s and New Zealand’s culture values are much closer to the countries of the Reformed West than to those of the USA and Canada, I have included Australia and New Zealand in the Reformed West and renamed the New West as North America (see Endnote c for details). In summary, these are:
Reformed West — Western European societies strongly affected by the Reformation; North America — USA and Canada; Old West — Mostly Catholic parts of Western Europe being core parts of the Roman Empire; Returned West — Catholic and Protestant parts of post-communist Europe returning to the EU; Orthodox East — Christian Orthodox or Islamic parts of the post-communist world, mostly parts of former USSR; Indic East — Parts of South and South East Asia under the historic influence of Indian culture; Islamic East — Regions of the Islamic world formerly parts of the Arab/Caliphate, Persian and Ottoman empires; Sinic East — Parts of East Asia under the historic influence of Chinese culture ; Latin America — Central and South America and the Caribbean; Sub-Saharan Africa — African countries south of the Sahara. Oceania — Pacific Island states with predominantly Melanesian and Polynesian populations
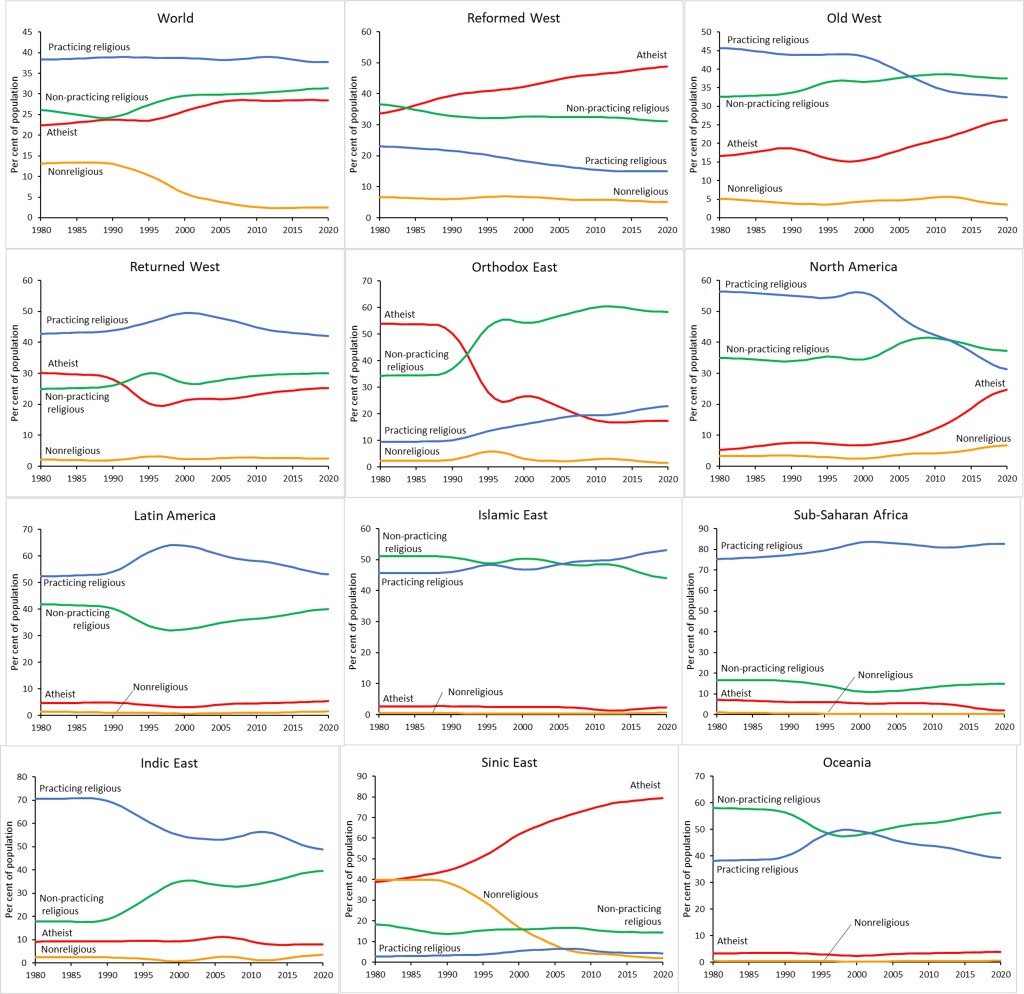
The following plots show estimated religiosity trends for the world as a whole and for these 11 culture zones:
These plots illustrate the extreme diversity of religiosity trends across regions. Western countries (Reformed West, Old West, North America) are characterised by rapidly rising prevalence of atheism and corresponding decline in practicing religious. The former Eastern bloc countries (Returned West, Orthodox East) are characterised by a large drop in atheism prevalence and corresponding rise in religious categories following the collapse of the Soviet Union around 1991. More recently, atheism is rising and practicing religious falling in the Returned West, following a similar path to that taken by Western Europe.
The Orthodox East has had continuing decline in atheism and the non-practicing religious have become the dominant group at around 55% of the population, far more than the practicing religious. A 2018 Pew Research Center Report [5] examined this more closely and found that for most people in the former Eastern bloc, being Christian (whether Catholic or Orthodox) is an important component of their national identity, with many people embracing religion in the post-Communist period as an element of national belonging, even though they are not highly religious.
Latin America, the Islamic East and Sub-Saharan Africa are the “religious” culture zones characterised by very high prevalences of practicing and non-practicing religious people and very low prevalences of non-religious and atheists. The Indic East also has very low prevalences of the irreligious, but in contrast to the other “religious” zones, has had a shift from practicing to non-practicing religious. This may very well be largely reflecting the increasing levels of Hindu nationalism in India.
Iran and other Islamic countries generally report very low levels of atheism, 2.4% on average, and I suspect this is lower than reality because of the quite severe social and legal consequences in many Islamic countries. The WVS uses telephone interviews and its quite likely irreligious respondents would be fearful of being identified if they respond honestly to a telephone interview. A recent internet survey provides some support for this concern. A June 2020 internet-based survey collected responses from 40,000 Iranians living in Iran. Respondents took part in the survey anonymously, and would have felt safer to express their real opinions than in telephone surveys or surveys conducted at respondents’ residence.
The contrast with the results of the most recent 2020 World Values Survey for Iran are extreme. The latter found that 43% of Iranians are practicing Muslims (similar to the online survey estimate for total Muslims, 53% are non-practicing and only 1.5% say they do not believe in God. In the WVS, 91% say they believe in life after death, 92% believe in heaven and 88% believe in hell. The online survey found that over 60% said they did not perform the obligatory daily Muslim prayers. This is in the same ballpark as the 53% who were classified as non-practicing in the WVS.
Reading between the lines of the WVS, and taking into account the severe consequences of being apostate or atheist in Iran, it supports the conclusion of Arab and and Maleki [6] that Iran is becoming much more secular. Around 53% of respondents in their online survey reported coming from practicing religious families but losing or changing their religion in their lifetime. This increasing secularity is also supported by the evidence of dramatic declines in the fertility of Iranian women over recent decades, with population growth in 2020 dropping below 1%. It’s quite likely that real levels of irreligion are higher in many other Islamic countries than the survey data suggest.
The Sinic East is of course dominated by China. Around 1980, apparently equal numbers of people in this region identified as atheist and non-religious. There has been a dramatic drop in the non-religious prevalence with a corresponding rise in the prevalence of atheism. The overall prevalence of irreligion has remained fairly stable and high. Its difficult to know what to make of this, or whether it reflects any real change, given the possibility that the Chinese language version of the WHS questions may have changed in some way over time, or their interpretation has changed given the overall lack of fit of the WVS religious questions with the non-theist religions that are most common in China.
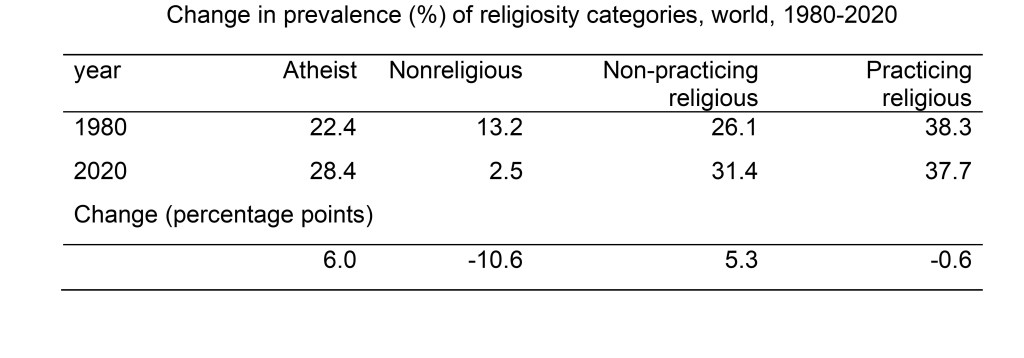
At global level, the prevalence of practicing religious has barely changed over the last 40 years, as has the prevalence of atheism, but there has been a shift from non-religious to atheist and to non-practicing religious, the latter reflecting mainly the change in former Soviet bloc countries. The relatively small changes in prevalence of religiosity at global level over the last 40 years conceal quite substantial changes in developed countries and in former Soviet countries, in opposing directions. The following table summarizes global changes in the prevalence of religiosity categories over the 40-year period 1980 to 2020.
The overall global prevalence of irreligion (atheist plus nonreligious) has declined somewhat, but a substantially higher proportion of the irreligious identify as atheist in 2020 compared to 1980. Is irreligion likely to increase in the future. If the economies of developing countries continue to grow, with decreasing levels of poverty, and education levels continue to improve, it is likely that religiosity in these countries will decline in the longer term. But if the pandemic and global heating crises derail the historical development trends, then population growth due to the higher fertility levels of Islamic and African countries will ensure that the overall religiosity of the world will increase in the future.
If on the other hand, the very low levels of irreligion in Islamic countries and Africa do not increase, then the higher fertility levels of these regions will ensure that the overall religiosity of the world will increase in the future. In an era of joint global environmental and pandemic crises, with rising populism and rejection of science and global institutions, its entirely possible that the developing countries will not pass through the equivalent of the Western Reformation resulting in freedom of thought and religion and decreasing levels of premodern religious values (see previous post here).
Endnotes
a. Interpolation and projection of religiosity trends from 1980 to 2020
For countries with data for three or more waves of the IVS, trends in the prevalence of the four religiosity categories were estimated at country-level as follows:
Values for single missing waves between two other waves were estimated using the geometric average for the two waves with data
For countries in the Returned West or Orthodox East, the average change in prevalence due to the breakup of the Soviet Union was estimated using the average for those countries with data for the first wave in the 1980s and the second wave in the 1990s. This average jump was used to estimate values for the first or second wave for countries where one of these was missing.
For countries where one or more early waves or one or more late waves were missing, prevalences were projected forwards or backwards using the median annual rate of change calculated at culture zone level for countries without missing waves.
Population-weighted average trends were then calculated for each culture zone with the following two exceptions. For the Returned West and Orthodox East, prevalences were assumed constant prior to 1991. For Islamic East countries, flat trends were assumed from 1980 to earliest available data, as Turkey is the only Islamic country with data prior to 2000, and its trends are probably not representative.
For countries with data from only one or two waves, forward and back projections to 1981 and 2018 were made using the average trends calculated in step 4 above for each culture zone.
For projections from the Wave 7 survey year to 2020, a conservative approach was taken to avoid making extreme projections based on substantial differences between Wave 6 and Wave 7 estimates which may reflect variations in survey sampling or procedures rather than real change. For each country, the recent trend was estimated using data from survey waves in the period 2000-2020, with each earlier wave being given 15% less weight in the regression than the subsequent wave. Average annual rates of change (aar) were also calculate from the Wave 6 and Wave 7 average prevalence estimates for each culture zone.
Where the regression aar were more extreme than the culture zone average aar, an average of the two was used for projection to 2020. Where the regression aar and the culture zone aar were of opposite signs, the regression aar was halved before use for projection. To be even more conservative, if the last Wave for a country was more than a year earlier than 2020, the rate of change from the survey year to 2020 was assumed to be aar1.5.
Finally, annual estimates for all years from 1980 to 2020 were prepared as follows:
Values prior to 1981 (the actual or projected first wave values) were assumed to be constant at the first wave values
Values beyond 2020 were also assumed to be constant at the 2020 value
Annual values between waves were estimated by linear interpolation
Annual values from 1980 to 2020 were smoothed using a 5-year moving average.
b. Imputation of religiosity for countries not included in the WVS/EVS.
Religiosity categories were imputed for 12 countries using data from Win/Gallup surveys for years 2012, 2015 and 2017 [7-9] which includes a question “Are you a religious person?” with the same response categories as the WVS/EVS question. These countries were Afghanistan, Cameroon, the Democratic Republic of the Congo, Cuba, Fiji, Kenya, Mongolia, Panama, Papua New Guinea, North Korea and South Sudan. Religiosity category prevalences for Israel were imputed from a Pew Research Centre survey which also included similar questions on religiosity [10].
For the remaining 63 mostly small countries, religiosity was imputed using culture-zone-specific regressions of the IVS religiosity prevalences against Pew Research Centre country-specific estimates for the year 2020 of religious affiliation distributions for 8 religious categories, including “other” and “none” [11].
c. Definitions of culture zones used to group countries
I am using the 10 culture zones defined by Welzel [4], with one modification. Because Australia’s and New Zealand’s culture values are much closer to the countries of the Reformed West than to those of the USA and Canada, I have included Australia and New Zealand in the Reformed West and renamed the New West as North America. The culture zones are defined as follows:
Reformed West — Western European societies strongly affected by the Reformation: Denmark, Finland, France, Germany, Iceland, Netherlands, Norway, Sweden, Switzerland, United Kingdom, plus Australia and New Zealand; North America — USA and Canada; Old West — Mostly Catholic parts of Western Europe being core parts of the Roman Empire: Austria, Belgium, Cyprus, Greece, Ireland, Israel, Italy, Luxembrg, Malta, Portugal, Spain; Returned West — Catholic and Protestant parts of post-communist Europe returning to the EU: Croatia, Czechia, Estonia, Hungary, Latvia, Lithuania, Poland, Slovakia, Slovenia; Orthodox East — Christian Orthodox or Islamic parts of the post-communist world, mostly parts of former USSR; Indic East — Parts of South and South East Asia under the historic influence of Indian culture: Bhutan, Cambodia, India, Indonesia, Laos, Malaysia, Maldives, Myanmar, Nepal, Pakistan, Philippines, Singapore, Sri Lanka, Thailand, Timor-Leste; Islamic East — Regions of the Islamic world that have been parts of the Arab/Caliphate, Persian and Ottoman empires; Sinic East — Parts of East Asia under the historic influence of Chinese culture: China, Hong Kong, Japan, Macau, Mongolia, North Korea, South Korea, Taiwan, Vietnam; Latin America — Central and South America and the Caribbean; Sub-Saharan Africa — African countries south of the Sahara Oceania — Melanesian and Polynesian countries: Fiji, Kiribati, Nauru, Palau, Papua New Guinea, Samoa, Solomon Islands, Tonga and Vanuatu.
References
EVS (2021): EVS Trend File 1981-2017. GESIS Data Archive, Cologne. ZA7503 Data file Version 2.0.0, https://doi.org/10.4232/1.13736
EVS/WVS (2021). European Values Study and World Values Survey: Joint EVS/WVS 2017-2021 Dataset (Joint EVS/WVS). JD Systems Institute & WVSA. Dataset Version 1.1.0, doi:10.14281/18241.14.
Haerpfer, C., Inglehart, R., Moreno, A., Welzel, C., Kizilova, K., Diez-Medrano J., M. Lagos, P. Norris, E. Ponarin & B. Puranen et al. (eds.). 2021. World Values Survey Time-Series (1981-2020) Cross-National Data-Set. Madrid, Spain & Vienna, Austria: JD Systems Institute & WVSA Secretariat. Data File Version 2.0.0, doi:10.14281/18241.15.
In the last couple of weeks, watching the end of the American war in Afghanistan and the Taliban takeover, I realized that Afghanistan is at the intersection of the war on terror and the war on drugs. I have been engaged for nearly 20 years now in work to update global estimates of conflict deaths and global estimates of deaths attributable to drug use.
Alfred McCoy has documented the role of opium production in the Afghanistan wars in his 2015 book In the Shadows of the American Century (see also how-the-heroin-trade-explains-the-us-uk-failure-in-afghanistan). After 20 years, the fighting (mostly) has ended, but western intervention has resulted in Afghanistan becoming the world’s first true narco-state. Opium harvesting along with US support sustained the Afghan resistance to the Soviet occupation in the 1980s, and the rise to power of the Taliban in the 1990s. In July 2000, the Taliban ordered a ban on all opium cultivation, and opium production fell by 94%. When the US invaded Afghanistan in 1991, they allied with the Northern warlords who had been active in the drug trade and smuggling. Opium production resumed and grew over the following two decades.
The UN Office on Drugs and Crime reported in its World Drug Report 2021 that Afghanistan reported a 37 per cent increase in the amount of land used for illicit cultivation of opium poppy during 2020 compared with the previous year. It was the third highest figure ever recorded in the coun- try and accounted for 85 per cent of the global total of opium production in 2020. The increase follows a trend that has seen the global area under opium poppy cultivation rise over the past two decades, particularly after 2009. In 2020, 43% of arable land in Afghanistan was under poppy cultivation. This was somewhat lower than the 60% peak in 2017. An estimated 95% of heroin in Europe comes from Afghanistan. Only a small proportion of heroin in the USA comes from Afghanistan, the majority comes from Mexico.
However, the US-led war on drugs with its attendant prohibition and criminalization keeps heroin prices and profits high, so that poppy cultivation remains far more profitable than other crops, and has played a significant role in funding both sides of the Afghan conflict. Narcotics are likely to have provided the Taliban with over half its revenues through organising cultivation, protecting harvests, and securing criminal supply routes into central Asia. Its military victory may now see a further expansion of the opiate economy. But what of the impact on the USA, where pharmaceutical and other synthetic opioids, particularly fentanyl have fueled an exponential increase in drug overdose deaths.
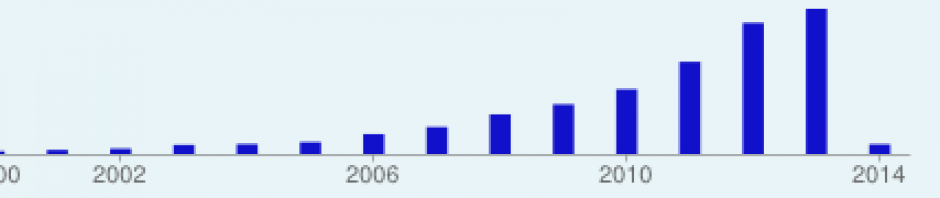
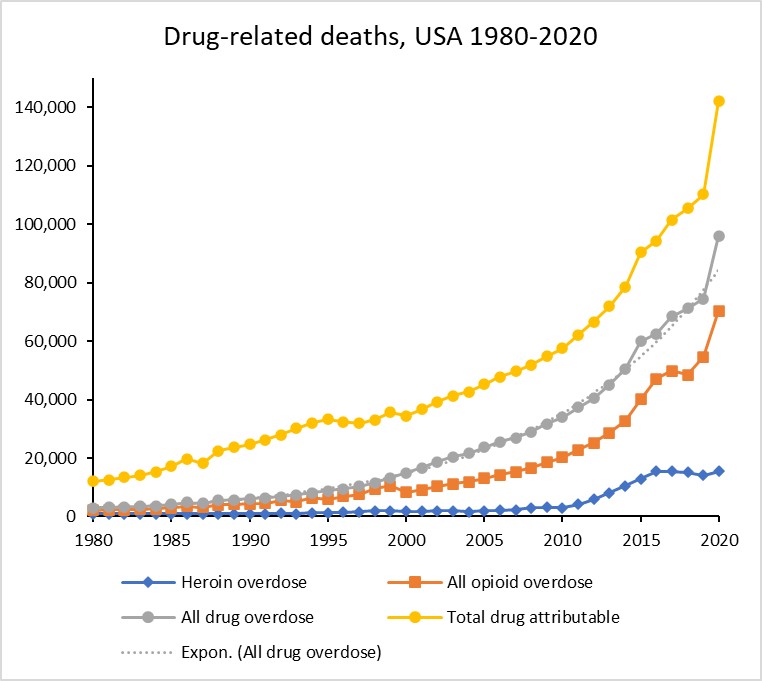
The CDC has recently released provisional estimates of US drug overdose deaths in 2020, and I have done a quick update of previous time series estimates for US opioid and other drug overdose deaths. The results are shown in the following plot. Dug overdose deaths (grey curve) have been rising exponentially for over three decades at an average annual growth rate of 10.4% (dotted grey curve) with a 29% jump in the pandemic year 2020 to 96,000 overdose deaths, of which 70,470 were due to opioids. Fentanyl and other synthetic opioids were responsible for most of these, heroin in 2020 was responsible for only around 15,400 deaths.
I have also done an approximate projection of total deaths attributable to drug use (yellow curve), which include overdose deaths, road injuries and suicide, as well as HIV and hepatitis B and C deaths associated with transmission through injecting drug use. The total attributable deaths in 2020 were estimated at around 140,000.
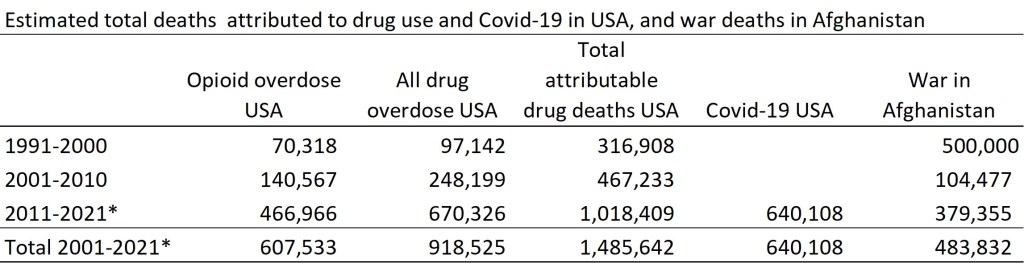
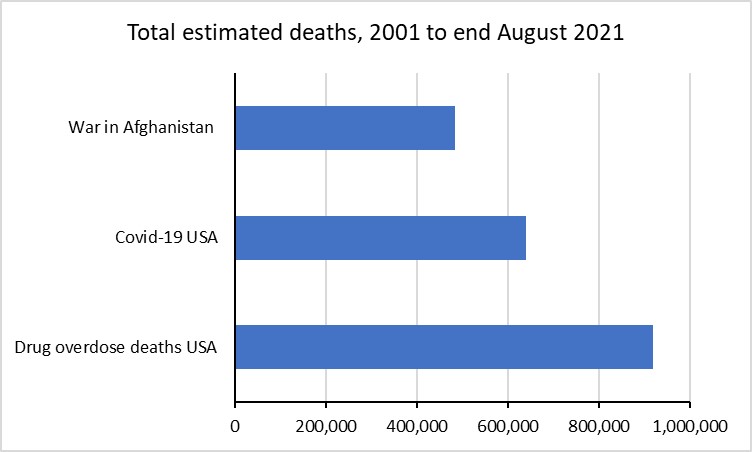
How does the mortality toll from the war on drugs compare with the deaths due to the Afghan conflict? Conflict death estimates for Afghanistan are hugely uncertain. Wikipedia has a review of various estimates for the Soviet war period of the 1980s, with 1.2 million deaths being a mid-range estimate. The post-Soviet period of civil war in the 1990s probably results in around another half million deaths. For the period from 2001, when the US commenced action against the Taliban and Al-Quaeda, to the end of US involvement in August 2021, I have updated earlier conflict death estimates prepared for WHO and UNICEF (see here for details) to include new data from ACLED, the Armed Conflict Location and Event Data Project. I have again drawn on the latest data from ACLED up to end of July 2021 to update estimates of total conflict deaths in Afghanistan from 1985 to 2021. For the years 2001 to 2021 inclusive, there were an estimated total of 483,800 conflict deaths.
A very approximate apportioning of this almost half a million deaths suggests that there were around 116,000 Afghan soldiers and police deaths, 51,000 Taliban fighter deaths and around 300,000 civilian deaths. Almost 2,500 US soldiers died, along with 1209 deaths among US allies (UK, Australia, Canada and EU forces), and almost 4,000 US civilian contractors.
These figures for deaths due to the Afghan war and for US drug-related deaths dwarf the current US total of just over 640,000 Covid-19 deaths to date, though of course these are concentrated into a much shorter period of one and a half years.
The table and figure below compares these death tolls by decade (and include 2021 for Covid-19 only):
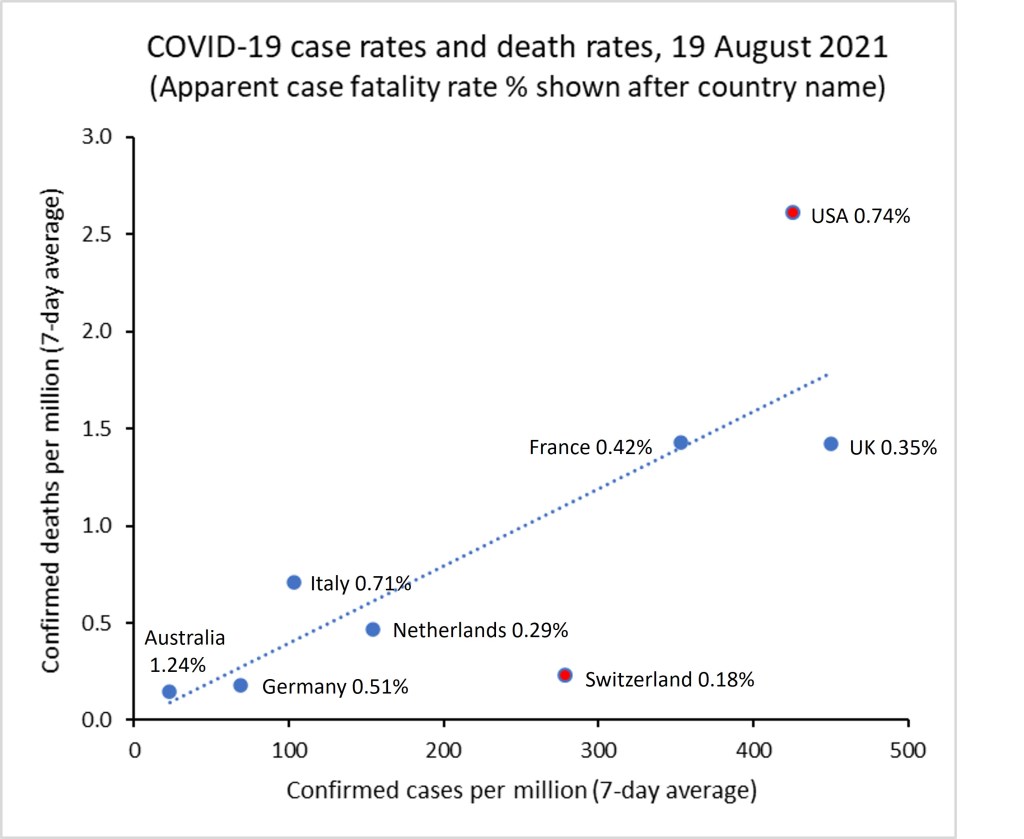
The graph below summarizes the COVID-19 situation as of yesterday (19 August 2021) for a selection of countries of interest to me. Confirmed case numbers have been rising in all these countries except the Netherlands (where case numbers have dropped to 30% of the peak on 19 July). Almost all the cases in this latest wave are the Delta variant.
Current case rates per million population are more than 50% of the previous maximum country-specific rate for the UK and USA, and exceed the previous maximum by 6% in Australia. The apparent case fatality rate (deaths/cases) is highest for Australia at 1.24% followed by the USA 0.74% and lowest in the Netherlands (0.29%) and Switzerland (0.19%). Around 60% of the population are fully vaccinated in the Netherlands (62%), UK (61%), Germany (58%), and Italy (58%). These are followed by the France (54%), USA (51%), Switzerland (50%) and last Australia (23%).
Ignoring Australia (which has very low case numbers and deaths relative to the other countries), there are two main outliers for apparent case fatality rates: Switzerland with very low CFR at 0.19% and the USA with a high CFR at 0.74%. Vaccination rates are similar in both countries, but my sense is that there is a huge difference with mask wearing and other social restrictions to limit transmission. And also large differences in health system access and health insurance coverage and adequacy.
The COVID Delta variant (B.1.617.2), which started spreading widely in India last October, is highly transmissible and might cause more severe illness and hence death. It has spread to many countries and is now the dominant strain in the UK. This website has up-to-date stats on the proportion of (tested) cases that are the Delta variant. In the week ending 24 June, Delta accounted for 16.7% of positive COVID-19 tests in Switzerland. In comparison it accounted for 62% of cases in Australia and 96% of cases in the UK. In terms of actual number of cases in the week, those percentages correspond to 52 cases in Switzerland, 9354 cases in the UK. And 16 cases in Australia.
The good news (at least for us in Switzerland) is that both the mRNA vaccines in use here (Moderna and Pfizer) are effective against the Delta variant. A single dose is 33% effective and two doses 88% effective. The AstraZenica vaccine in use in Australia and the UK is also about 33% effective for a single dose, and 60% effective after two doses. All the vaccines appear to substantially reduce the likelihood of severe illness and death. Currently, around 55% of the Swiss population are fully vaccinated (two doses) and the government aims to raise that to 80% by the end of the summer. Currently less than 5% of Australians are fully vaccinated and new lockdowns are being implemented across Australia. Sydney, Perth, Darwin and now Brisbane are all in lockdown, and Victoria just exited one.
The disastrous mishandling of the vaccine roll-out in Australia is entirely down to Scott Morrison, as the Australian prime minister has insisted on taking full federal responsibility for it. The folly of the government’s over-reliance on the AstraZenecca vaccine has now escalated into a public health disaster. Falsely claiming delays, EU blocks and supply issues, the problem of insufficient vaccines has been compounded as AstraZenecca is no longer advised for people under 50, leaving millions of Australians with no immediate prospect of vaccination. To make matters worse, the Prime Minister a couple of days ago off-the-cuff told reporters that any Australian over 16 could request vaccination by their GP. This directly contradicting the advice of government Chief Medical Officers, who had not been consulted, and left GPs confused as to whether this had involved any change to the legal indemnity rules for GPs (which currently would not cover GPs if a patient under 40 developed blood clots from the AstraZenica vaccination.
Stephen Duckett, a former head of the Victorian Health Department, has examined how the vaccine rollout was comprehensively bungled in a recent article on The Conversation.