Sixteen years ago, I published a paper in PLoS Medicine with detailed projections of deaths by age, sex and cause for all regions of the world, from year 2002 to 2030. That paper has proved very popular, with over 14,100 citations to date. Following the release in 2018 of the latest WHO update of causes of death for years 2000-2016, I carried out another update of projected global causes of death, extending the projections for the first time beyond 2030 to 2060.
These projections were also released on the WHO website in 2018 along with documentation describing the methods used. In the original projections, separate projection models were developed for HIV/AIDS, tuberculosis, lung cancer, diabetes mellitus and chronic respiratory diseases. As well as revisions to these models, additional special projection models were developed for malaria, maternal deaths, road injury, homicide, natural disasters and war and conflict.
I recently wanted to check up on some of the methods used, and discovered that the projections are no longer available on the WHO website. During my two decades with WHO, I always tried to ensure that older versions of WHO statistics and the methods used to produce them were archived on the WHO website in such a way that they continued to be available. This is important as WHO statistics get quoted and cited by many other publications and websites, and it is immensely frustrating when they cease to be available for anyone wanting to follow up citations of them. Particularly for global health statistics which are regularly or irregularly updated, it is important for transparency and replicability that revised data and methods can be compared with earlier versions. For this reason, the 2016-2060 projections and methods paper have been made available for download here. While the projections are outdated now, and also don’t take into account the impact of the Covid-19 pandemic, the novel methods developed for specific causes may also be of interest, particularly for road injury, natural disasters and conflicts.
Global mortality 2016-2060 — Business-as-usual scenario
See here for a previous post giving an overview of the projection results. These projections are “business-as-usual” projections under specified assumptions that do not specifically take account of trends in major risk factors apart from tobacco smoking, and to a limited extent, overweight and obesity. The downloadable spreadsheets includes point estimates for projected deaths by region, cause, age and sex under a business-as-usual scenario for projected covariates. Explicit uncertainty ranges were not included here, uncertainty in projections is better conveyed through comparison of optimistic and pessimistic scenarios with varying input assumptions (these were carried out but not released).
The number of significant figures displayed in worksheet cells in the Excel workbooks do not provide information on uncertainty ranges of projected estimates. The base scenario does not necessarily represent the best predictions or potential range of future global and regional health trends; it is possible that more sophisticated causal models incorporating projections of important determinants may provide better predictions for specific diseases.
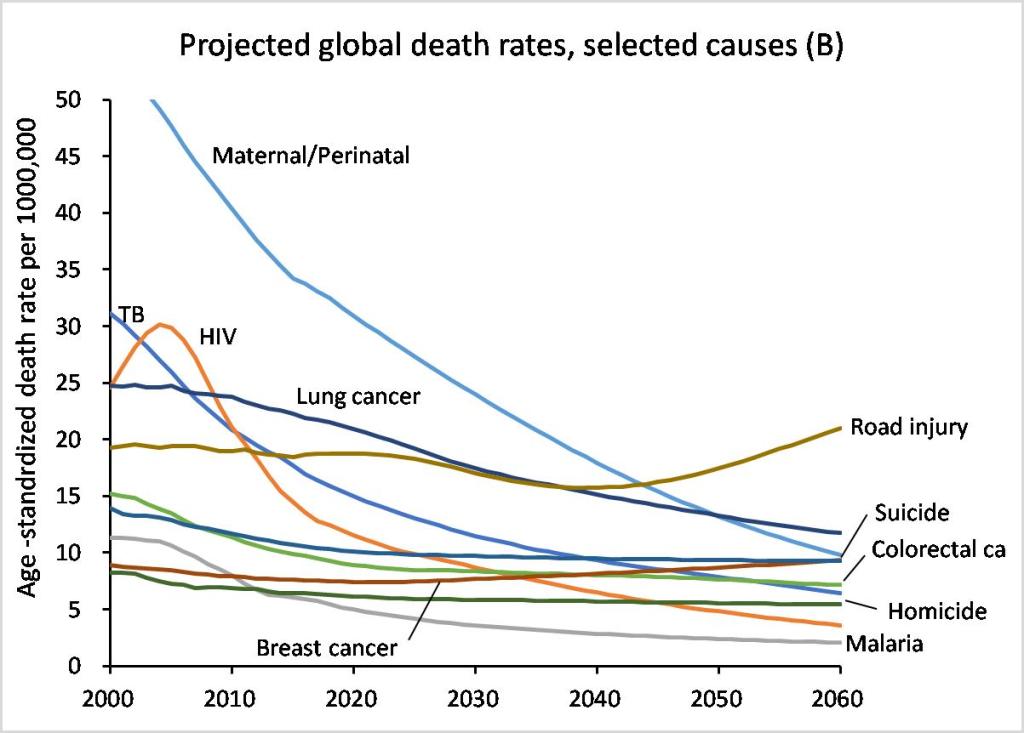
Apart from synchronising the new projections with the 2016 cause of death estimates, the cause-specific trends in the near term are synchronized with estimated recent trends over the last 10 to 15 years. In the longer term, broad trends are largely driven by projection equations which model the epidemiological transition from infectious to non-communicable diseases in terms of projections of average income per capita, average years of education, time, and for some causes also projections of smoking impact. At the global level, age-standardized death rates for most important causes are falling with time, faster in most cases for infectious, maternal and perinatal causes than for non-communicable diseases (see figures below). The main exceptions are for diabetes, breast cancer and road injuries. The specific projection model for diabetes is based on projections of the prevalence of overweight and obesity and that for road injury is based on projections of vehicles per capita with continued economic development.
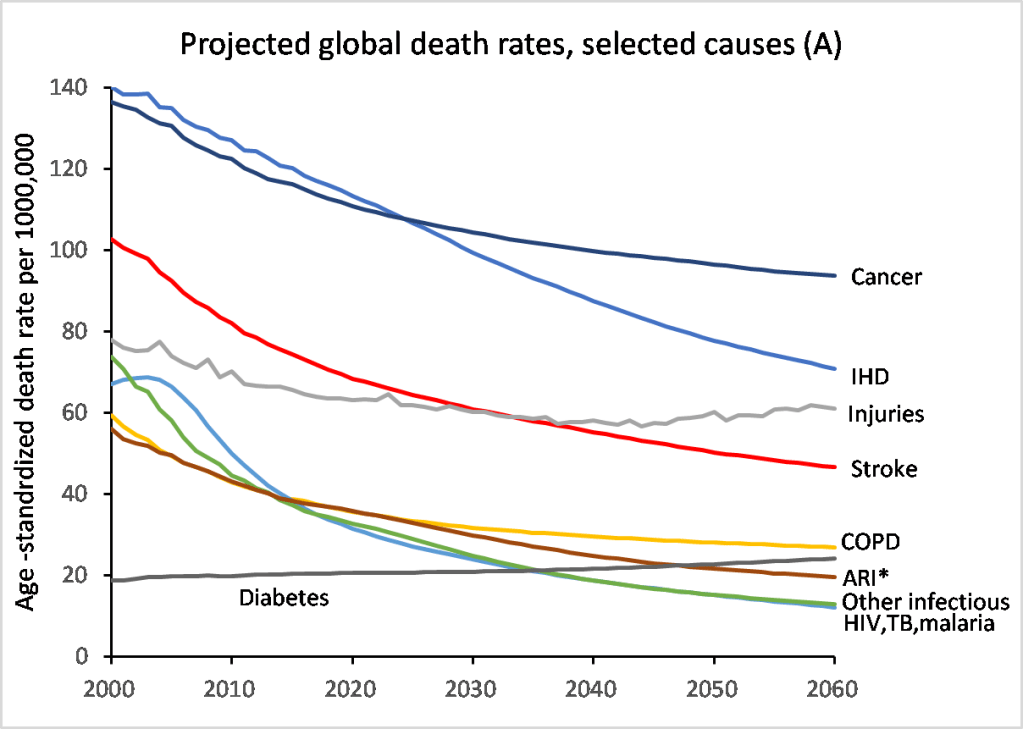
ARI = Acute respiratory infection (mainly pneumonia), TB = tuberculosis
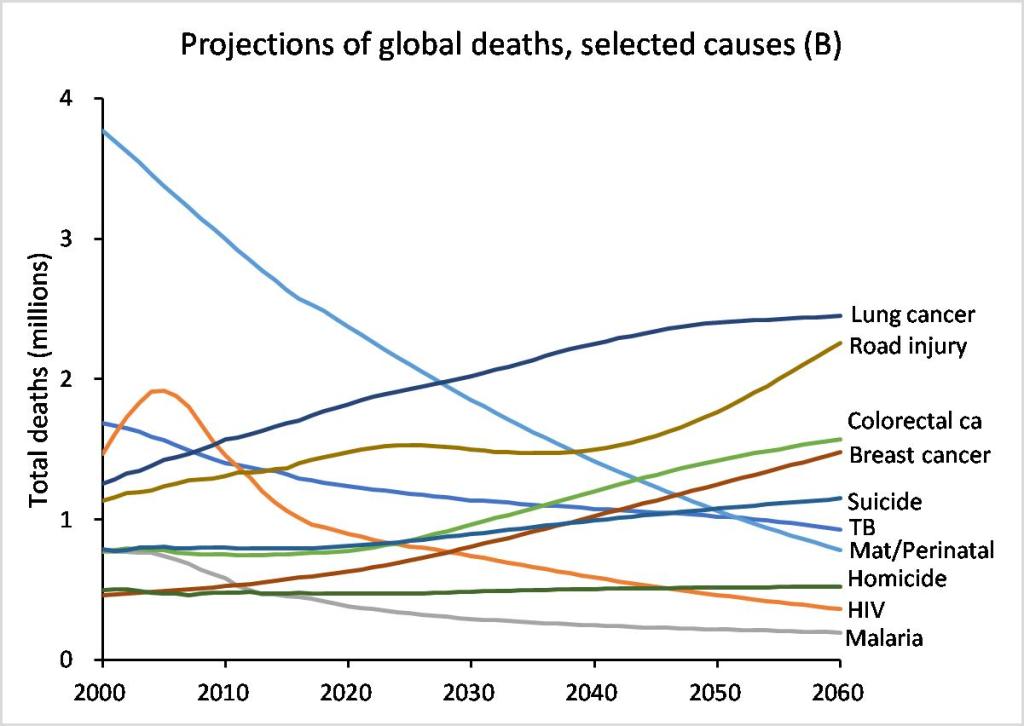
However, for many of these causes, the total projected deaths are rising with time because of population growth and ageing. Only the relatively fast declining infectious, maternal and perinatal causes are likely to also have declining total numbers of deaths (see the following two figures).
The projections of deaths by cause are not intended as forecasts of what will happen in the future but as projections of current and past trends, based on certain explicit assumptions. The methods based the disease burden projections largely on broad mortality projections driven by projections of future growth in income and increases in human capital in different regions of the world, together with a model relating these to cause-specific mortality trends based on the historical observations in countries with death registration data over the last 60 years. The results depend strongly on the assumption that future mortality trends in poor countries will have a similar relationship to economic and social development as has occurred in the higher income countries. If economic growth in low income countries is lower than the forecasts used here, and global warming results in additional adverse impacts on economic and social development, then the world may achieve slower progress and widening of health inequalities.
Projected global deaths in 2030 and 2060 under the business-as-usual scenario are 68.2 million and 101.8 million respectively. Projected global deaths in 2030 under the UN medium variant projections of the World Population Prospects 2017 (WPP2017) are 2% higher in 2030 at 69.5 million and 0.7% lower at 101.1 million in 2060. These global projections for all-cause mortality are remarkably close to the UN projections given that these are the sum of independent projections for 20 separate cause groups, whereas the UN projections are based on estimated trends in all-cause mortality and fertility. The results are also very similar for all regions except the South East Asian Region and the African Region. For the South East Asian Region, the UN projections are higher, with 3.5% more deaths in 2030 rising to 12% more deaths in 2060. For the African Region, the UN projections are slightly higher in 2030 but by 2060 are 12% lower.
