Purely statistical predictions of future trends in COVID-19 deaths or cases, even including predictive covariates, have been unable to make sensible forecasts that are not highly sensitive to slight additions of data. The only useful models have been the more traditional SIR and individual-based models of epidemic infectious disease spread in which scenarios allow some assessment of the impact of various social distancing measures.
It struck me there may be a way to make short-run projections of daily deaths, using information on recent trends in confirmed cases. I spent a couple of hours doing this yesterday, here is the result for Switzerland. I explain the simplistic modelling assumptions below, in what is intended only to be an exploratory analysis.

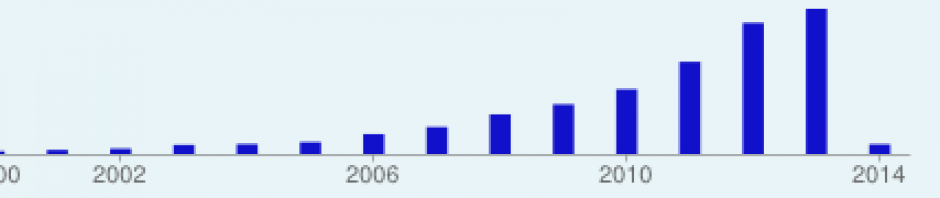
Reported daily new confirmed cases and deaths (dots) along with short-run projections.
A major issue is the quality of the available data on deaths and cases. Recent analysis of total mortality data for the pandemic period with similar data for previous years summarized in a recent New York Times article suggests that total deaths due to COVID-19 are around 60% higher than the reported COVID-19 deaths, which largely include only hospital deaths in many countries. These data are for countries with good death registration systems which cover 100% of deaths, albeit with some delays in registration and coding. For countries with poor or non-existent death registration, including most of Africa, the under-reporting will almost certainly be much higher. I’ve been looking at plots of daily deaths and noticed that there are occasional large increases in some countries for around 1 day in 7, and this may relate to timing of data compilation and reporting, or to “catch-up” when batches of deaths from outside the acute hospital sector are added. Additionally, the very strong age and sex dependence of fatality rates should mean that models need to take into account population age-sex structure and variation of case fatality rates and other factors by age and sex.
Confirmed case time series are also affected by the scope of testing and the extent to which the testing is restricted to specific risk groups or symptomatic people, or is extensive enough to approximate a population sampling. According to the data in Worldometers.info, country testing rates in developed countries, excluding those for some small populations under 1 million, range from around 10 per 1,000 in the UK up to around 35 per 1000 in some smaller European countries. For developing countries, rates can be much lower, less than 1 per 1,000 in many African and Asian countries. Trends in confirmed cases may be strongly influenced by trends in testing rates, as well as changes in the populations targeted for testing.
I downloaded latest data up to 25 April (CSSEGIS COVID-19 data) yesterday, and initially did some curve smoothing to look at trends in daily confirmed cases and deaths, mostly to see whether the epidemic does seem to have peaked in countries now discussing easing social distancing. It struck me that it may be possible to make use of these smoothed series to do some short-run projections of deaths out for around a week, without making strong assumptions about the shape of the curve, as was done by IHME in its recent modelling. Here is a plot for Switzerland of daily new confirmed cases and deaths.
My key insight was that trends in mortality should reflect trends in confirmed cases around 14 days earlier (based on a quick literature review). If testing rates are stable, this should allow projection of daily deaths out up to around 10-14 days based on the confirmed case time series. Furthermore, it should be possible to assess and project the trend in apparent case fatality rate (deaths divided by cases 14 days earlier) which should reflect the trend in testing rates and regime. So I spent a couple of hours yesterday having a go at doing this. This is not intended to be a serious attempt at prediction of short-run trends, as I’ve made some simplifying assumptions and picked a curve smoothing technique that was to hand, but not probably ideal. But I will compare reality in a week’s time with my projections, just for the heck of it.
In order to calculate the denominator (confirmed cases) for estimating apparent case fatality rates acfr, I assumed that the days d from diagnosis to death ranged from 8 to 21 days with a lognormal distribution with a mean of 14.1 days. In the limit where there was high levels of testing, I next assumed that the acfr should approach that observed for confirmed cases in Wuhan (2.2%) but adjusted for the age distribution of the country. So the long-term acfr, lacfr, will be higher for developed countries with older population distribution, such as Italy (4.3%) and lower for developing countries such as South Africa (1.2%).
I projected recent trend in ln(acfr-lacfr) using simple regression against time with an exponential weight, giving weight of 1 to the observation for the most recent day, and weights decreasing by factor 0.85 each day into the past. If the recent observed acfr was already lower than my estimated lacfr, I left it constant at its current value. For countries with recently declining acfr, the projection asymptotes at lacfr. For countries with increasing acfr, that increase is projected to continue. Only in a handful of countries does that projection result in dramatically increasing acfr. I’m not sure what that says about the data series, but there is clearly some issue with the data.
The following plots show two typical examples of the projection of apparent case fatality rates in which it starts very high (when deaths have started to occur but there is still very limited testing) and declines in a reasonably regular manner. The third example, for Sweden, is a country in which there is much more variability in the apparent case fatality rate, perhaps reflecting low numbers of cases and deaths, and also likely variations in data quality or scope.


Next, I did a similar short run projection of ln(smoothed daily confirmed cases) out 7 days into the future, and then calculated the denominators associated with smoothed daily deaths out 10 days into the future. This denominator projection actually uses only the first two days of the cases projection for the small fraction of the denominator associated with early deaths. I mostly did the projection of cases to see what a slightly longer projection of deaths looked like, but don’t present that here.
The plots below show examples of these projections for a few selected countries. I’ve added some comments in the captions.

Australia has a low case fatality rate, and appears to have indeed done extremely well in containing the epidemic, as is being claimed.
Switzerland shows clear evidence that the epidemic peaked in late March to early April and is in decline.

The US projections are for continuing increasing daily cases, and for slight decline in daily deaths, probably partly reflecting increasing levels of testing. These projections are probably not that meaningful, as the US has epidemics occurring with different timing in various States, and State level modelling would probably give more nuanced results.

Its unclear from this graph whether daily cases have plateaued, but a projected declining case fatality rate associated with increasing levels of testing has resulted in a projected decline in daily deaths. It will be interesting to see whether reality does better than this.

Clearly a continuing decline for Italy, though projected deaths are nearly flat. Again, reality will hopefully do better.

A rising apparent case fatality rate has resulted in a projected continuing increase in deaths. However, Germany has concluded that daily deaths are declining and it is time to relax social restrictions. Unclear from this data, but the death rate is much lower than for most other European countries.

France also show a peak followed by decline which is projected to continue.

The Netherlands has a death rate 40% higher than Switzerland, though the confirmed case rate is only 70% that of Switzerland. But both appear to be declining.

Larger variability in daily cases and deaths make it difficult to know whether these projected rising numbers are plausible. But there does not seem to be any good evidence the epidemic has peaked in Sweden.
These projections are simplistic, and really mainly to explore the data and the possibility of dealing with changing testing rates in doing projections. A genuinely useful projection model of this type would not only need to have better evidence-based inputs but also ideally data disaggregated by age and sex, and for larger countries with epidemics in various population centres with different timing, to model at regional rather than national level. The likelihood of “later” epidemics starting in care home or other special population and either spreading into the community or causing later epidemic waves may also need to be taken into account. To a limited extent, it may be possible to treat the data on confirmed cases and hospital deaths as “indicators” of the epidemic and its dynamics, even though large numbers of cases and deaths are not included in such statistics. But large untested populations in institutions such as care homes or prisons could make a huge difference in some countries with relatively large institutionalized populations.
Still I conclude that there may be some value in using case data to make very short-run projections of deaths. Or perhaps to test the usefulness of such an approach using scenario results from one of the SIR or individual-based models.

Pingback: COVID-19 short-run projections | Mountains and rivers
Great work Colin. I have been following your posts. They make a lot of sense. I can’t believe how bad the analysis and reporting is, in general; particularly from sources in the US. I came across a video by Dr Erickson and Artin Massihi. They were making absolutely absurd claims based on flawed statistics. It seems like various interest groups in the US want to create models to suit their own political or ideological agenda and totally ignore basic science and statistical method. I would be interested in a statistical study to examine the degree to which misinformation is undermining attempts to control the spread of the virus in the US. Also another interesting study would be to examine the level of scientific literacy in the US to see what role it is playing in the proliferation of pseudoscience, (Anti Vaxxers, Anti GMO, Climate change deniers etc).
Thanks. It is alarming how much false information is circulating. I tried engaging with a facebook friend who was sharing lots of conspiracy posts about coronavirus being caused by 5G, although apparently it was also engineered in a lab by Bill Gates, and on the other hand it is really harmless and WHO is lying to us that it causes deaths. Asked her to show me even one piece of evidence that passed the basic tests for evidence (that it is not innuendo, or false, or just a video from someone else, or….) and she defriended me. Once there is no shared reality anymore, its hard to have a shared response, which is what is needed for infectious pandemics.
The problem with the COVID-19 projections is that the Murray bull was let out of the Gate, and now the Bill has to be paid! IHME death projections for USA today revised to 134,375
Nice! I see they are belatedly doing smoothing before modelling daily numbers, making the projection fit to the end of the data curve (which it did not before, leading to weird outcome that the next-day deaths was 70% outside the projection confidence interval for one-day-into-future). And they are belatedly building in some sort of case transmission model to somehow get around the restriction of the symmetric curve fitting. Overall, it seems they should have thought a little more before leaping into it. But I guess getting the attention of the White House was probably more important than getting projections to behave reasonably.
Pingback: COVID-19 projections and reality | Colin Mathers