
Working for the World Health Organization over the last 20 years and dealing with national health authorities, I’ve been quite fascinated by the variations across cultures and countries in values and beliefs, and the huge influence they have on willingness to accept or implement evidence-based public health interventions. More broadly, it seems fairly clear that people’s beliefs play a key role in economic development, the emergence and flourishing of democratic institutions, the rise of gender equality, and the extent to which societies have effective government.
So I was particularly interested to learn recently that data from the most recent wave of the World Values Survey was being released in July. This wave has been interrupted by the coronavirus pandemic, but the data for 48 countries whose survey were completed by early 2020 has recently been released on the WVS website.
Data from previous waves of the World Values Survey were used by political scientists Ronald Inglehart and Christian Welzel to identify two major dimensions of cross cultural variation across the world. They refer to these as Traditional values versus Secular-rational values and Survival values versus Self-expression values. The map below uses data from the 6th wave of the WVS carried out during 2010-2014 to plot countries according to their factor values for these two dimension. Moving upwards on this map indicates increasing secular values and moving to the right increasing self-expression values.
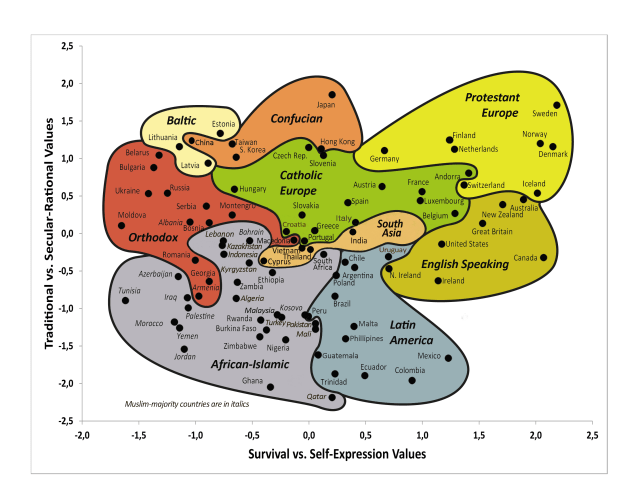
Inglehart-Welzel Culture Map 2010-2014. Source: http://www.worldvaluessurvey.org/WVSContents.jsp
Traditional values emphasize the importance of religion, parent-child ties, deference to authority and traditional family values. Secular-rational values place less emphasis on religion, traditional family values and authority.
Survival values place emphasis on economic and physical security. It is linked with a relatively ethnocentric outlook and low levels of trust and tolerance. Self-expression values are associated with gender equality, relative acceptance of divorce, abortion, and homosexuality and rising demands for participation in decision-making in economic and political life.
Inglehart and Welzel have used factor analysis to extract these two dimensions from WVS data for 12 questions. The final factors are rotated, and all 12 questions contribute to the factor scores, which are correlated. I was interested to examine their approach more closely and attempt to use it, or a related approach, for an analysis of all the WVS data, including the recent release.
There have been seven waves of the World Values Survey, the first in 1980-1982 and the seventh underway since 2017. Additionally, the recent 2017 wave of the European Values Survey includes many of the same items as the WVS and has data for 30 countries. Together the recent wave of the WVS+EVS include data for 77 countries.
I downloaded all unit record data for the WVS from their website [1-4]. In total, the World Values Surveys plus the European Values Surveys now includes data for 117 countries or territories and over 638,000 respondents. The dates of the waves, and the number of respondents by wave and survey type are shown in the table below.

I first set out to replicate the Inglehart-Welzel analysis of the two cultural dimensions based on data for 12 questions. I immediately ran into problems as the various documentation on the website has several differing lists of variables included in the factor analysis, and trying all three, none replicated the values for the factors in the data files. And indeed, there were at least three different sets of factor values in various places. I think what has happened is that the Welzel analysis and summary indicators have evolved over time.
I did my best to match his description of the analysis of waves 1-6 using factor analysis, and my resulting factor values for the wave 6 countries correlate highly with Welzel’s secular values index (svi) and emancipative values index (evi) with correlation coefficients of 0.92 and 0.97 respectively. See scatterplots below. So my factor analysis gives somewhat different results but very highly correlated with Welzel values. Its quite possible that the factor procedure I am using in stata does not exactly replicate the factor analysis or scoring produced by Welzel using SPSS.

In his recent book, Freedom Rising [6], Welzel mostly abandons factor analysis in favour of explicitly constructed indicators based on conceptual alignment of variables with the target latent construct. However, as with the factor analysis, he is assigning equally spaced scores between 0 (lowest) and 1 (highest) for categorical response categories to questions in the WVS/EVS. So for example,
How important is religion in your life? Questionnaire Responses Welzel rescale
Very important 0
Rather important 0.333
Not very important 0.667
Not at all important 1
When jobs scarce: men should have more right to job
Agree 0
Neither 0
Disagree 1
This a priori forces the factor analysis to treat all the categories for each question as equally spaced on the underlying factor even though responses for different questions may have very different means and be skewed across the response categories quite differently. In other words, the end categories for questions may map to very different values on an underlying latent construct, but are all forced to values 0 and 1.
A recent paper has highlighted the dangers of using factor analysis on ordered-categorical survey data (e.g., Likert items). The authors conclude that the common practice of factor analysing ordered-categorical data such as Likert items leads to very high risks of incorrect and misleading diagnoses of the latent structure of the items, with dire consequences for conceptualisation, replication and comparability, and evidence-based interventions, behaviour and policy [5]. They advise analysts to investigate latent structure with IRT models instead. When the latent trait is continuous, but the data is a set of ordered categorical responses, the appropriate approach is to use Item Response Theory (IRT) models; this is the most common term in applications in educational or psychological testing, where these models are very widely used.
I have implemented a form of IRT analysis using the stata procedure gsem, for structural equation modelling, with ordered probit regression. For f1, the first latent variable (survival-emancipative dimension), I used data for three questions of gender equality (jobs, politics, education) and three questions on acceptance of homosexuality, abortion, and divorce. I estimated the second latent variable (f2 — traditional-secular dimension) using data for three questions on sources of authority (nation pride, government, parents) and three questions on religion (importance, belief, practice
Country-wave average values for f1 and f2 were computed taking sampling weights into account. Because the year of survey varied within waves, and also not all countries were in each wave, I used a projection procedure to estimate culture values for year 2019 by projecting forward from the most recent country-year available since 2005. Values were regressed on time and the following covariates: GDP per capita (PPP dollars), average years of education (adults 25+), general fertility index, UNDP gender inequity index and regional indicator variables, with random effects at country level. The following map shows the resulting estimated cultural latent variables f1 and f2 for 2019.

Because there are 105 countries displayed on this map, it becomes harder to draw nice coherent cultural groupings as in the Inglehart-Welzel map shown before. I’ve also adopted and adapted the 10 cultural groupings used by Welzel in his more recent book [6], into 8 groupings as follows:
New West and West — Western Europe and overseas offshoots of Western Europe
Returned West — Catholic and Protestant parts of post-communist Europe returning to the EU
Orthodox — Christian Orthodox or Islamic parts of the post-communist world, mostly parts of former USSR
South Asia — Parts of South Asia under the historic influence of Indian culture
South East Asia — Parts of South East Asia excluding those under historic influence of Chinese culture
Sinic East — Parts of East Asia under the historic influence of Chinese culture
Latin America — Central and South America and the Caribbean
African-Islamic — African countries south of the Sahara, together with regions of the Islamic world that have been parts of the Arab/Caliphate, Persian and Ottoman empires
The general topology of this map is similar to the Inglehart-Welzel map, with Scandinavian countries to the top right, Sinic countries to the top left, and African-Islamic countries to the bottom left. However, there are some considerable differences in the locations of countries relative to each other, and the positions of some individual countries – no doubt reflecting the difference between arbitrary metrization of Likert scales versus estimation of latent values using IRT methods.
I have also made a more recent post which examines regional and country-specific trajectories in cultural values over the forty-year period 1980 to 2020. A more interesting issue, and one that I may spend some time on, is to develop a better set of parsimonious values latent variables from the rich data of the World and European Values Survey. At a time when democratic values, free speech and human rights seem to be under increasing attack in all regions, it would be nice to develop better tools to describe how these are valued across the world.
References
- Inglehart, R., C. Haerpfer, A. Moreno, C. Welzel, K. Kizilova, J. Diez-Medrano, M. Lagos, P. Norris, E. Ponarin & B. Puranen et al. (eds.). 2014. World Values Survey: All Rounds – Country-Pooled Datafile Version: https://www.worldvaluessurvey.org/WVSDocumentationWVL.jsp. Madrid: JD Systems Institute.
- Haerpfer, C., Inglehart, R., Moreno,A., Welzel,C., Kizilova,K., Diez-MedranoJ., M. Lagos, P. Norris, E. Ponarin & B. Puranen et al. (eds.). 2020. World Values Survey: Round Seven–Country-Pooled Datafile. Madrid, Spain & Vienna, Austria: JD Systems Institute& WVSA Secretariat[Version: http://www.worldvaluessurvey.org/WVSDocumentationWV7.jsp].
- Gedeshi, Ilir, Zulehner, Paul M., Rotman, David, Titarenko, Larissa, Billiet, Jaak, Dobbelaere, Karel, Kerkhofs, Jan. (2020). European Values Study Longitudinal Data File 1981-2008 (EVS 1981-2008). GESIS Datenarchiv, Köln. ZA4804 Datenfile Version 3.1.0, https://doi.org/10.4232/1.13486.
- EVS (2020): European Values Study 2017: Integrated Dataset (EVS 2017). GESIS Data Archive, Cologne. ZA7500 Data file Version 3.0.0,doi:10.4232/1.13511
- van der Eijk C, Rose J (2015) Risky Business: Factor Analysis of Survey Data – Assessing the Probability of Incorrect Dimensionalisation. PLOS ONE 10(3): e0118900. https://doi.org/10.1371/journal.pone.0118900
- Welzel C. Freedom Rising. Human Empowerment and the. Quest for Emancipation. 2013. Cambridge: Cambridge University Press. https://www.cambridge.org/core/books/freedom-rising/80316A9C5264A8038B0AA597078BA7C6

Pingback: Trends in cultural values across 105 countries: 1980 to 2020 | Colin Mathers
Pingback: Variations and trends in cultural values across 105 countries, 1980 to 2020 | Mountains and rivers
Pingback: Religiosity and atheism in 2020 | Colin Mathers
Pingback: Religingumas ir ateizmas 2020 m. – Ateizmas ir ateistai
Very creative posst