Back in January, I posted on climate change (are-humans-heating-up-the-world) and included a graph of the Keeling curve showing the increase in atmospheric carbon dioxide concentration. The Mauna Loa Observatory in Hawaii has just released its latest results showing that atmospheric carbon dioxide concentration hit 415 ppm on June 3rd (two days ago). This is the second highest annual rise in the past six decades.

May is the most significant month for global carbon dioxide concentrations because it is the peak value for the year, before the growth of vegetation in the northern hemisphere starts to absorb the gas from the air. The seasonal peak and fall can be seen in the Keeling curve, named after Charles Keeling, who started the observations on Mauna Loa in 1958 because of its isolation in the Pacific Ocean.
As recently as the 1990s, the average annual growth rate was about 1.5ppm, but in the past decade that has accelerated to 2.2ppm, and is now even higher. This brings the threshold of 450ppm closer sooner than had been anticipated. Concentrations of the gas have increased every year, reflecting our burning of fossil fuels.
Scientists have warned for more than a decade that concentrations of more than 450ppm risk triggering extreme weather events and temperature rises as high as 2C, beyond which the effects of global heating are likely to become catastrophic and essentially irreversible on a human time scale.
The Scripps Institute of Oceanography has a video animation showing the dramatic rise in carbon dioxide concentration from the mid-20th century. The screenshot below from the video shows that the carbon dioxide concentration was below 300 ppm for most of the last three centuries but started to rise dramatically after World War II.

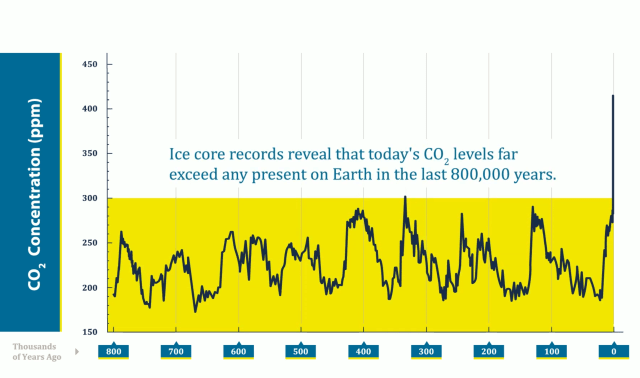
The video then zooms out to show the Keeling curve for the last 800,000 years putting the accelerating rise in atmospheric carbon dioxide this century in stark perspective. For the evidence linking carbon dioxide rise to global warming refer to my previous post.